
Despite the buffeting that Canada’s financial services sector has faced from volatile markets and rising competition, the full-service brokerage business is thriving. Investment advisors surveyed for Investment Executive‘s (IE) 2018 Brokerage Report Card are enjoying solid growth and improved efficiency.
In fact, the results of this year’s Report Card reveal the retail brokerage business is in fine health overall. Advisors’ average assets under management (AUM) rose year-over-year, as did productivity. (Productivity is measured by AUM per client household.)
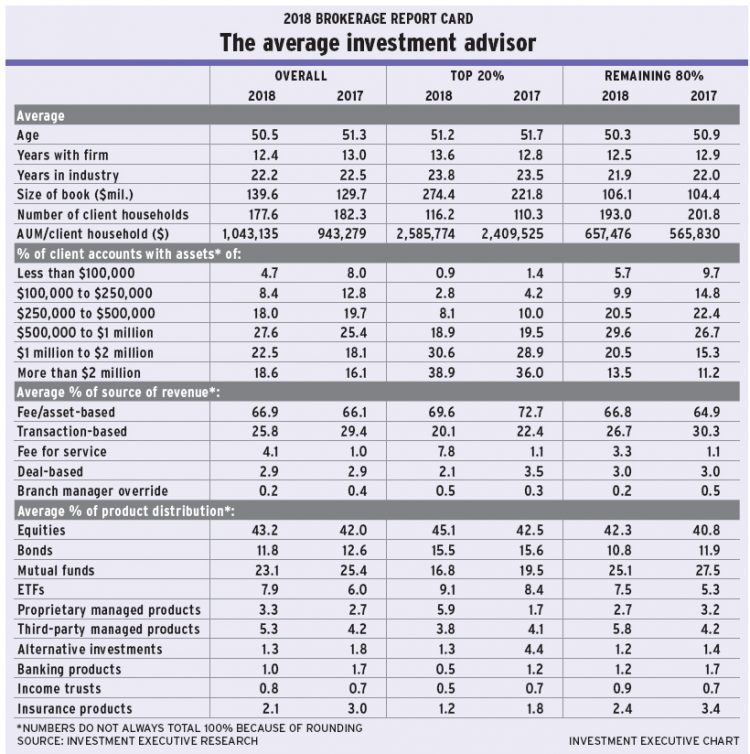
Indeed, the average advisor’s AUM rose to $139.6 million from $129.7 million year-over-year. These gains took place even though the size of the average client roster declined slightly, as advisors now serve an average of 177.6 client households, down from 182.3 last year.
This combination of increasing AUM and a modest decline in client households resulted in solid growth in advisors’ productivity. The average AUM/client household now is $1,043,135, up from $943,279 in 2017.
Although the growth in both average AUM and productivity is evident for both the top performers (defined as the top 20% of advisors, in terms of AUM/client household) and the remaining 80% of advisors, the underlying trends are quite different for the two segments of the advisor population.
For the top performers, growth in productivity was powered by strong growth in AUM, which was being fed, in part, by an increase in the number of clients. Conversely, for the remaining 80% of advisors, client numbers were down and the increase in AUM was slight year-over-year.
In fact, for the top 20% of advisors, average AUM rose by a substantial $52.6 million year-over-year. This year, average AUM among the top producers was $274.4 million, up from $221.8 million last year. At the same time, the average number of client households these top performers serve rose to 116.2 from 110.3 in 2017.
This increase in client household numbers for the top 20% of advisors undoubtedly accounted for some of the impressive AUM growth for this segment of the advisor population. Indeed, the account distribution data for this segment indicates that the clients they’ve added have accounts of $1 million or more.
In fact, the very largest accounts – those worth $2 million or more – represented 38.9% of the average top performer’s book of business, up from 36% last year. And accounts in the $1 million to $2 million range comprised 30.6% of the average top performer’s book, up from 28.9% in 2017. Combined, the two largest account categories represented 69.5% of the average top performer’s book, up from 64.9% last year.
This increase in the proportion of accounts that come in at the top end of the distribution range, combined with slightly higher client numbers, resulted in greater productivity for the industry’s top producers: $2.6 million in AUM/client household, up from $2.4 million last year.
For the remaining 80% of advisors, the reported increase in productivity was even stronger: average AUM/client household rose to $657,476 this year from $565,830 in 2017. However, the underlying trends for this segment of advisors are the opposite to those for the top producers: modest AUM growth and lower client numbers powered growth in productivity for this segment of advisors.
Indeed, the remaining 80% of advisors reported average AUM of $106.1 million, up from $104.4 million last year. Yet, average client rosters were down to 193 households from 201.8 last year.
Although the top 20% of advisors appear to have enhanced their productivity mostly by adding high net-worth (HNW) clients, the remaining 80% of advisors appear to have done so primarily by culling their lower-end clients.
The data on account distribution for the remaining 80% of advisors show they reduced the percentage of accounts in their books worth less than $500,000. In fact, accounts worth less than $250,000 were notably fewer year-over-year.
Last year, the remaining 80% of advisors reported that 9.7% of their books was made up of accounts worth less than $100,000, while almost 14.8% of their books was held in accounts worth between $100,000 and $250,000. This year, both those figures were down sharply: accounts of less than $100,000 dropped to 5.7% of their books and accounts in the $100,000 to $250,000 range dropped to 9.9%.
For this segment of advisors, all of the account categories worth more than $500,000 grew. The $500,000 to $1 million range comprised 29.6% of the average book in this year’s survey, up from 26.7% last year, while accounts worth more than $1 million accounted for 34% of the average book, up from 26.5% last year.
Along with intensifying focus on HNW clients among both segments of advisors, another persistent trend is the shift toward fees and away from transaction-based compensation. This year, it wasn’t just fee-/asset-based revenue that gained ground from transaction-based revenue; advisors’ reliance on fee-for-service arrangements rose significantly as well.
The notable increase in advisors’ reliance on fee-for-service arrangements suggests that advisors are turning to this compensation model amid increasing sensitivity to compensation-related conflicts of interest – and a growing desire to avoid those conflicts.
For example, the total population of advisors surveyed this year reported that 25.8% of their revenue came from transactions, down from 29.4% last year. The share of book for fee-/asset-based sources continued to edge higher, and reached 66.9% this year vs 66.1% from last year’s survey. But the proportion of revenue coming from fee-for-service arrangements jumped to 4.1% this year, up from just 1% in 2017.
Advisors’ reliance on fee-for-service arrangements remained relatively low in absolute terms, but the use of fee-based compensation rose notably – particularly among the industry’s top producers. However, both segments of advisors reported that about 1.1% of their revenue came from fee-for-service sources in last year’s Report Card. This year, the industry’s top producers reported that 7.8% of their revenue was derived from fee-for-service arrangements.
Although top producers’ reliance on transactions continued to decline, some of the shift toward fee-for-service revenue may have come from fee-/asset-based revenue as well. The top 20% of advisors reported that 69.6% of their revenue came from fee-/asset-based sources, down slightly from 72.7% year-over-year.
For the remaining 80% of advisors, the reliance on fee-for-service revenue remained notably lower, at 3.3%. However, this still was a sharp increase compared with last year’s survey.
Some of the same concerns that are driving shifts in advisors’ revenue sources also may be motivating the evolution in asset allocations. The most notable change in advisors’ reported asset mix was a decline in their use of mutual funds, to 23.1% of their books from 25.4% year-over-year – with a simultaneous rise in the use of ETFs. (Those investments’ share of book increased to 7.9% from 6% year-over-year.)
This decline in the use of mutual funds and increase in the use of ETFs was evident in both segments of the advisor population. The top performers reported less reliance on mutual funds and more on ETFs compared with their lower-producing peers, but the trend for both advisor segments is moving in the same direction.
The top 20% of advisors re- ported that mutual funds comprised 16.8% of their clients’ portfolio holdings, down from 19.5% last year. ETF use among these advisors rose to 9.1% from 8.4% year-over-year. For the remaining 80% of advisors, mutual fund usage was higher, at 25.1%, down from 27.5% in last year’s survey. Furthermore, their use of ETFs was lower than their peers, at 7.5%, but still rose from the 5.3% reported in last year’s survey.
The rise in the popularity of ETFs and decline for mutual funds came amid a general trend toward passive investing strategies and increasing attention to the conflicts that arise with the use of products that utilize embedded commissions structures. (See story on page 18.)