Although the results of Investment Executive‘s (IE) 2018 Brokerage Report Card reveal that investment advisors’ individual businesses have never been stronger, advisors’ assessments of their firms were nowhere near as positive. And with many firms failing to meet many of their advisors’ expectations at a time when the very nature of the business is under review, advisors face a foggy future.
Much of this uncertainty stems from the fact that many of the brokerages in the Report Card – and the industry at large – are going through significant changes. In fact, the advisors in this year’s survey reported an all-time Report Card high of $139.6 million in assets under management, up from $129.7 million in last year’s survey. Furthermore, advisors were more productive in terms of assets under management per client household, as the average topped the $1-million mark. That increase in productivity was a result of advisors culling their lower-end clients to focus on adding more high net-worth clients to their rosters. (See story on page 16.)
In some cases, a firm’s aggressive growth strategy is straining critically important support services, such as the back office. In other instances, advisors are dealing with management changes or are growing impatient for long-promised upgrades to technology. These and other concerns shone through in the Report Card’s main ratings table. More specifically, 58 of the ratings that advisors gave their firms for this year’s Report Card were lower by half a point or more and only 41 categories were higher by that same margin. (These figures exclude the “overall rating by advisors”; see page 14.)
Two firms in particular – BMO Nesbitt Burns Inc. and ScotiaMcLeod Inc., both based in Toronto – experienced notable changes in their ratings year-over-year.
In Nesbitt’s case, advisors rated their firm higher by half a point or more in 16 of 33 categories. The firm’s “IE rating,” the average of all the ratings by Nesbitt’s advisors, also rose by that margin. This shift follows a dismal showing in last year’s Report Card, in which Nesbitt’s ratings dropped by half a point or more in 21 of 31 categories – as did the firm’s IE rating and overall rating by advisors – as advisors took issue with management’s push toward establishing a more bank-like culture. (See story on page 17.)
Since then, Nesbitt’s advisors have seen several high-level changes at the bank-owned brokerage. Charyl Galpin, who was sole head of the brokerage since 2014, left her position in August 2017. Andrew Auerbach was appointed as her replacement six months later, in February 2018. (Research for this Report Card takes place in January through to mid-February.)
“There’s a fresh wind blowing,” says a Nesbitt advisor in Ontario.
ScotiaMcLeod advisors, on the other hand, are having a harder time seeing positive change at their firm. This sentiment is evident in ScotiaMcLeod’s ratings, which declined by half a point or more in 18 categories this year as well as in the overall rating by advisors. This is the second year in a row in which this brokerage suffered a similar fate, as its ratings dropped by that margin in 17 of 32 categories in 2017. A significant reason why ScotiaMcLeod advisors continue to express dissatisfaction with their firm is because of lingering tension resulting from a series of layoffs among the advisor roster that took place in 2016.
“[We] went through a mass firing,” says a ScotiaMcLeod advisor in Ontario. “The way it was handled – it was a mess.”
Advisors at the bank-owned firms need to depend on their branch managers in navigating through such large-scale changes – or even through the corporate labyrinth at some firms. Although advisors at the bank-owned firms were divided on the benefits of working with a producing vs a non-producing branch manager, more advisors leaned toward the negative side of that debate.
“There’s lack of communication and interaction with the staff – and direction in guidance,” says an advisor in British Columbia with Montreal-based National Bank Financial Ltd. “[My branch manager] is a producing manager who has a huge book of business.” (See story on page 20.)
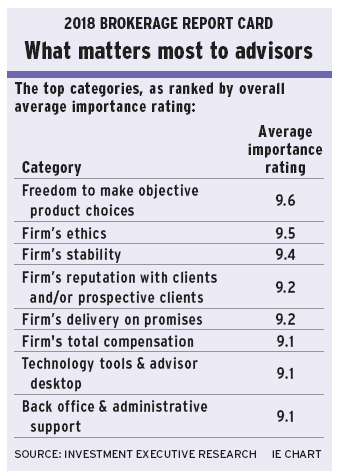
Advisors also were frustrated with the level of support they receive from their back-office departments. Indeed, advisors gave the “back office and administrative support” category an overall average importance rating of 9.1, but an overall average performance rating of only 7.6. The difference between the two ratings, known as the “satisfaction gap,” was the second-highest among all the categories in this year’s Report Card. The reasons for this gap vary: some advisors complained about cutbacks in the back office; other advisors noted that their firm’s recent growth has strained the back-office services on which advisors depend.
“We can definitely improve our [back-office] processes,” says an advisor in Ontario with Toronto-based Raymond James Ltd., which has seen significant growth recently in the number of advisors at the firm. “They are antiquated.” (See story on page 19.)
But while advisors are trying to find their way through the changes and issues at their firms, many advisors also face potential changes to the way they’re compensated. Early in 2017, the Canadian Securities Administrators (CSA) published a consultation paper on embedded commissions. In light of that paper, advisors surveyed for the Report Card were asked if they favour regulatory action to address the concerns surrounding the use of embedded commissions models.
Almost two-thirds of advisors support regulatory action – up to a point. Although there were some exceptions, most of the advisors who favour CSA action argued that more transparency around fees, rather than an outright ban on embedded commissions, is what’s needed.
“Give clients the proper information so they can make proper choices,” says an advisor in B.C. with Toronto-based CIBC Wood Gundy. “Our [client account] statements don’t even show embedded commissions properly. Either show it all or don’t show it at all, but you can’t have a hodgepodge system.” (See story on page 18.)
HOW WE DID IT
The annual brokerage report Card is one of Investment Executive‘s (IE) most anticipated and prestigious special reports. Thus, much work has to be done each year to gather the ratings and comments on which the Report Card is based.
This year, IE research journalists Sophie Allen-Barron, Anthony Burton, Ramona Leitao and Curtis Panke spoke with 549 investment advisors at 12 brokerages during a six-week span in January and February to find out how advisors feel about their firms’ efforts over the past year.
As in previous editions of the Report Card, survey participants were asked to provide two ratings for each of the 33 categories on the main table (see page 14): one for the firm’s performance in that category; another to indicate the importance of that category to the advisor’s day-to-day business. Advisors provided ratings on a scale of zero to 10, with zero meaning “poor” or “unimportant” and 10 meaning “excellent or “very important.”
A rating in green on the main table indicates that a firm’s performance score in that category rose by half a point or more compared with the survey conducted in 2017. A rating in red indicates that the firm’s performance score in that category declined by the same margin year-over-year.
A new addition to this year’s main table is the inclusion of the total number of advisors surveyed per firm. This was done in an effort to increase the transparency of IE‘s survey process. As in years past, IE targeted 50 advisors per firm for the larger, national players; 40 for mid-sized national firms; and 30 for regional independents.
In addition to the data on the main table, advisors also were asked to share their thoughts on larger industry trends. More specifically, two supplementary questions were added to this year’s questionnaire.
In the first question, advisors were asked if they feel that regulatory action is required to address the concerns that regulators have raised regarding the industry’s use of embedded commissions.
In the second question, advisors were asked if they felt their firm’s cybersecurity efforts were adequate to ensure the protection of their data and those of their clients.
Following a trend established in recent years’ Report Card coverage, IE staff worked on web-exclusive content for InvestmentExecutive.com. This includes a video with IE staff summarizing the results of this year’s Report Card, as well as two slideshows meant to provide greater insight into the results of this year’s survey.