How does a deadly pandemic affect the insurance advisory business? For the advisors who responded to the latest edition of Investment Executive’s Insurance Advisors’ Report Card survey, books of business get bigger, as advisors focus on their core insurance business.
After a year’s absence due to Covid-19, the Report Card is back for 2021, revealing an industry that has changed since 2019.
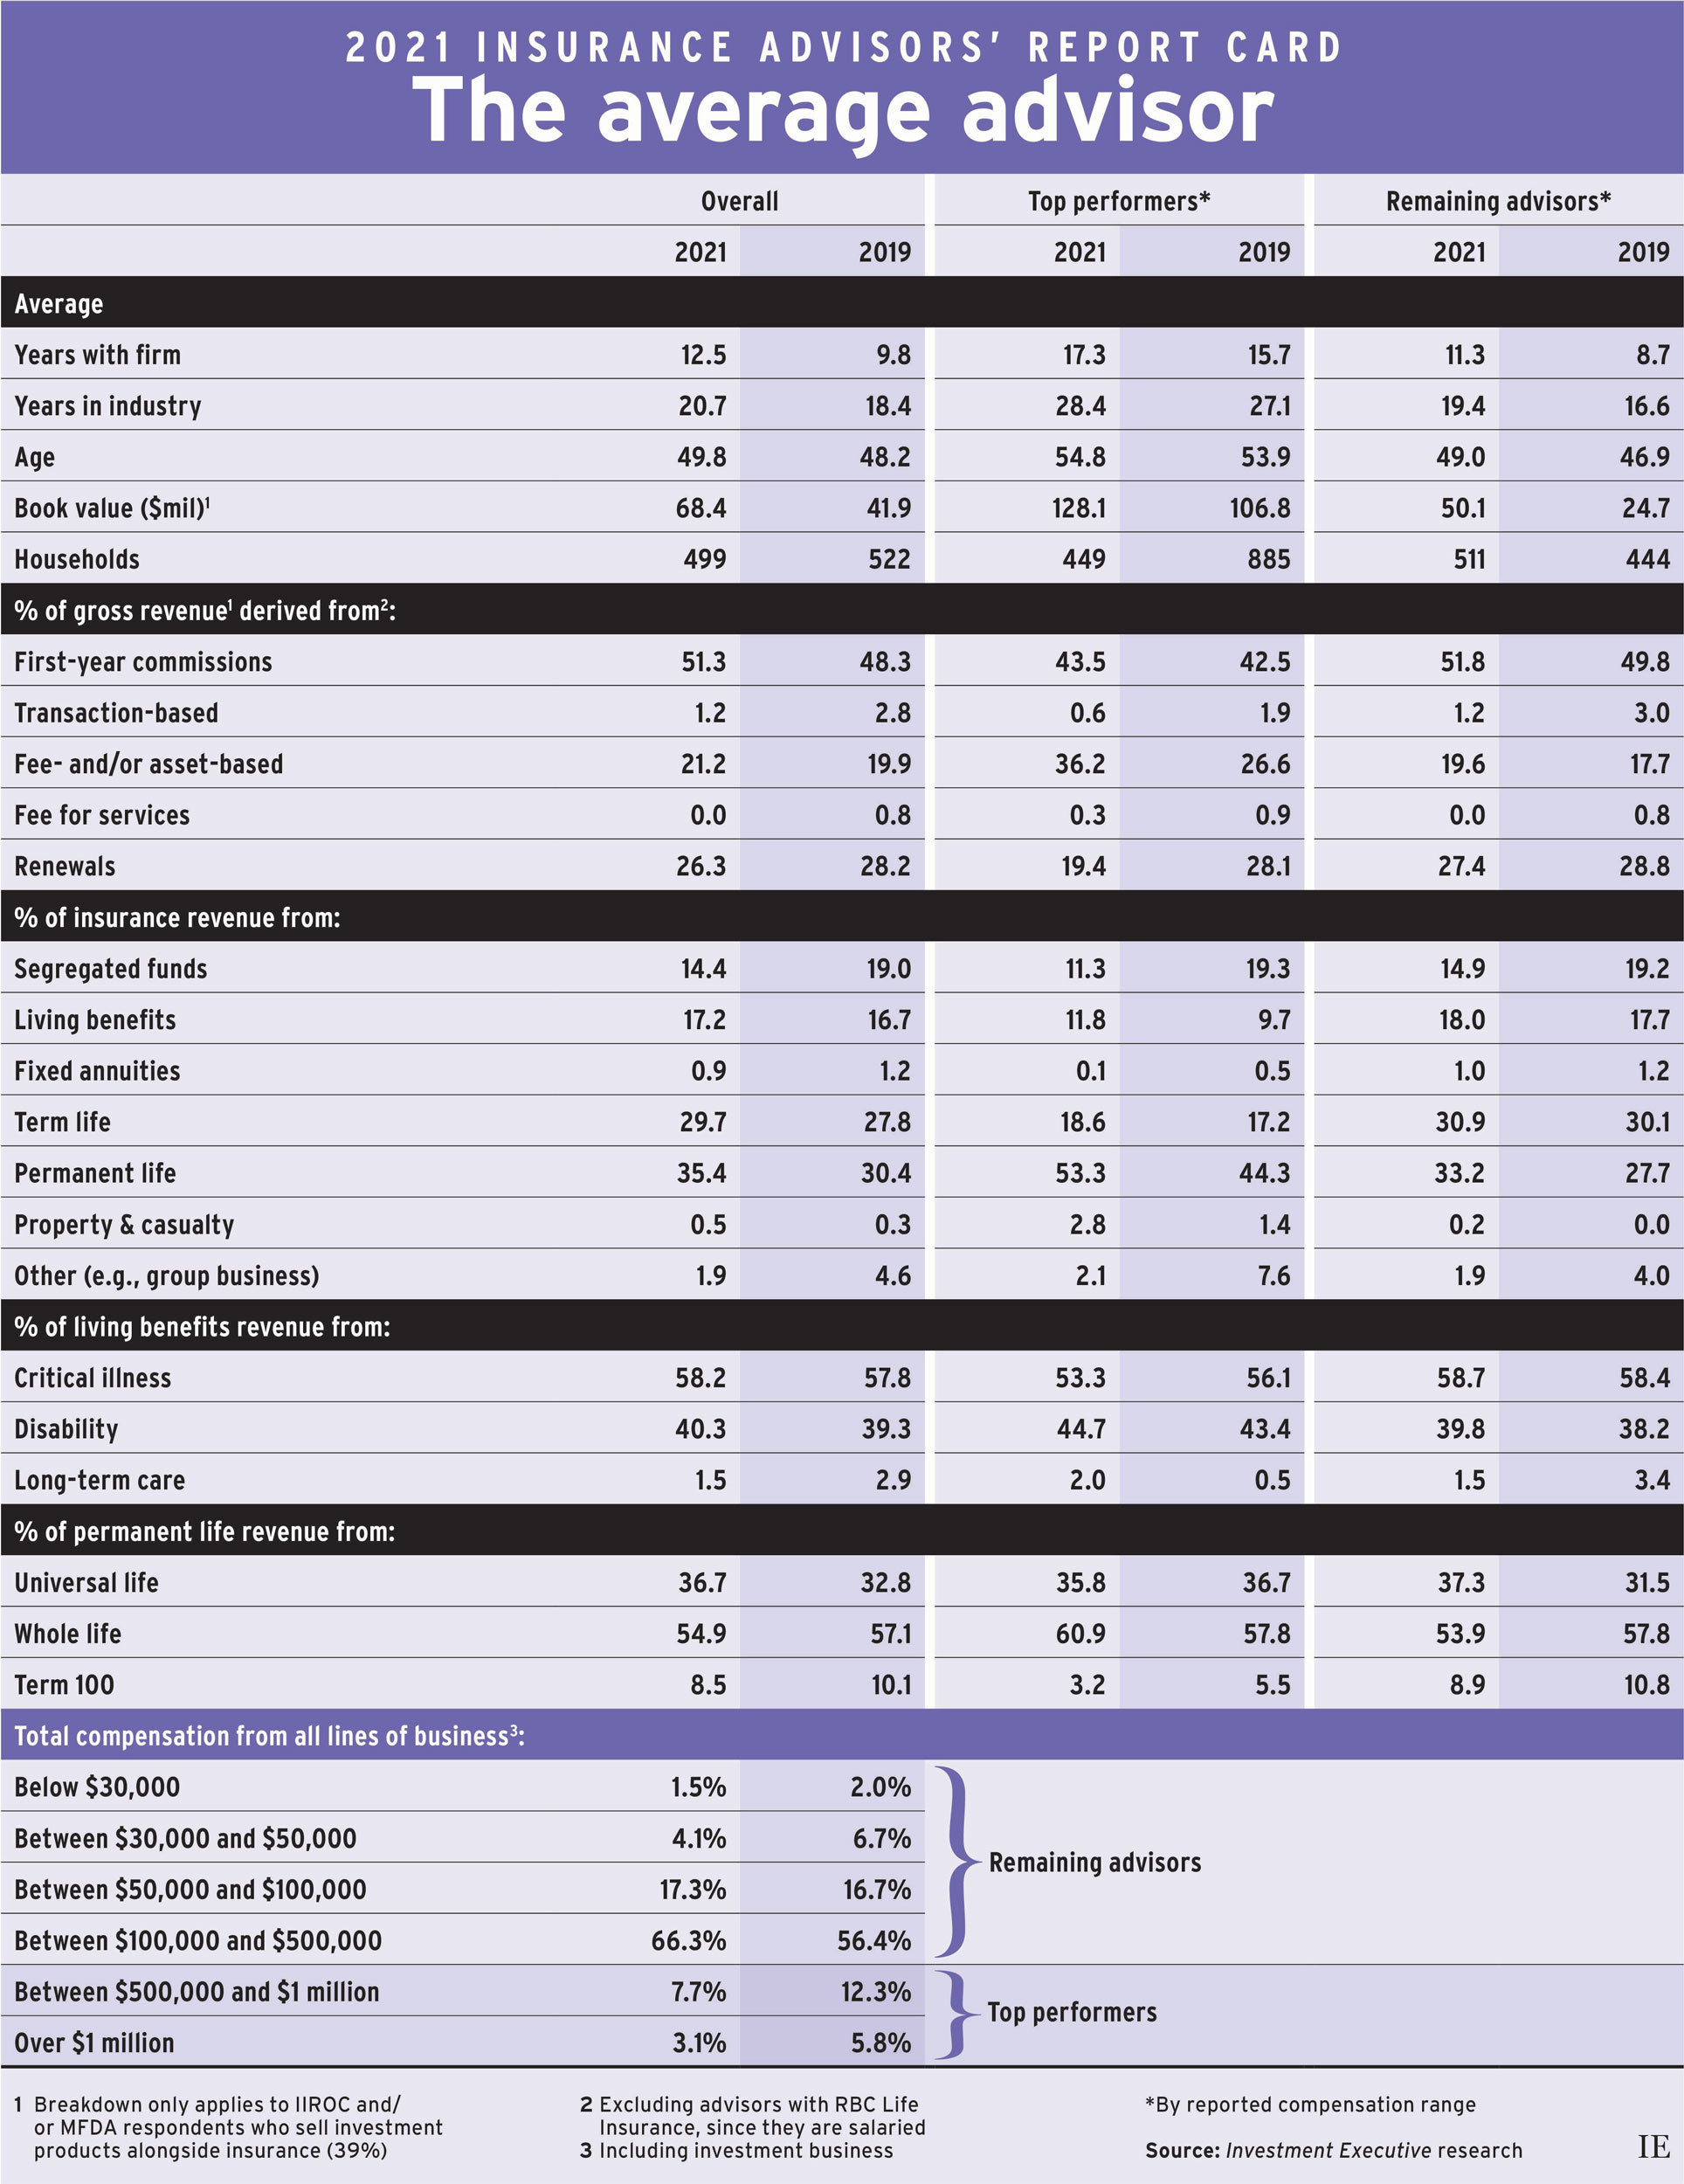
Average assets under management (AUM) for investment products soared, rising to $68.4 million in this year’s Report Card (reported as of Dec. 31, 2020), from $41.9 million in 2019. While average assets were up by more than 60% over the past two years, only about one-third of respondents provided data on AUM. For most advisors, insurance remained the primary line of business.
Therefore, we now rely on advisors’ reported compensation to define the sector’s top performers, rather than AUM per client household as in other Report Cards. Advisors who reported making more than $500,000 per year are classified as top performers.
Back in 2019, that cohort represented 18.1% of the advisors in our survey. This year, only 10.8% of respondents reported making over $500,000 per year, which gave us a narrower sample when comparing the top performers against the rest of the industry.
This year, the share of advisors in our survey who made more than $1 million per year was down to 3.1%, from 5.8% in 2019. The proportion in the $500,000–$1 million category dropped to 7.7% from 12.3%.
These declines at the top end of the compensation scale were mirrored at the bottom end, as the share of advisors making less than $50,000 per year was down notably from two years ago (dropping to 5.6% from 8.7%).
However, the industry’s “middle class” grew over the past two years. In 2021, 66.3% of reps reported making between $100,000 and $500,000 per year, up from 56.4% in 2019.
One key factor that separated the advisors at the top end of the pay scale from the rest of the industry was longevity. Not only were the top-producing advisors meaningfully older — almost 55 years old versus 49 for the rest of the industry — they also had been in the business much longer.
The average top performer had more than 28 years of industry experience, compared with 19.4 years for the rest of the industry. In other words, top performers were six years older on average than other advisors, and had been in the business nine years longer.
Top performers also had a different mix of compensation sources than the rest of the industry. For example, the highest-earning advisors relied less on first-year commissions — although first-year commissions remained the dominant source of revenue across the industry. In this year’s survey, first-year commissions represented 43.5% of the average top performer’s compensation, compared with 51.8% for the rest of the industry.
Fee- and/or asset-based revenue ranked second for top performers, representing 36.2% of the average top performer’s compensation, up from 26.6% in 2019. Renewals dropped to 19.4% this year, from 28.1% two years ago.
For the rest of the industry, renewals remained the second-most important source of revenue, accounting for 27.4% of the average rep’s compensation, down slightly from 28.8% in 2019. Fee- and asset-based sources edged higher to 19.6% of the average book, from 17.7% two years ago.
Despite these various compensation mixes, advisors across the industry reported higher allocations to core life insurance products. Overall, permanent life accounted for 35.4% of the average book, up from 30.4% in 2019. Term life represented 29.7% of the average book, up from 27.8%. At the same time, allocations to segregated funds dropped to 14.4% this year, from 19.0% in 2019.
These trends were evident among top performers, too. These advisors were already heavier users of permanent life products than the rest of the industry, but that usage has grown notably over the past two years. In this year’s Report Card, permanent life accounted for more than half (53.3%) of the average top producer’s book, up from 44.3% in 2019. Term life accounted for 18.6% of the average top advisor’s book, up from 17.2% in 2019. Conversely, seg funds dropped to 11.3% of the average top performer’s book, from 19.3%.
Permanent life was also the most popular product category for the rest of the industry, at 33.2% of the average book, up from 27.7% in 2019. Term life was a close second, at 30.9%. Seg fund allocations slipped for these advisors as well, dropping to 14.9% this year from 19.2% in 2019.
This rise in core insurance product allocations throughout the industry suggests insurance was likely a top priority for both reps and their clients amid a pandemic that forced many Canadians to consider their own mortality.
Click image for full-size chart