This article appears in the Oct. 2022 issue of Investment Executive. Subscribe to the print edition, read the digital edition or read the articles online.
The 2022 insurance advisors’ Report Card (IARC) revealed notable shifts in the frontline insurance business. The proportion of top-earning advisors increased significantly, while the mix of products that reps are selling has shifted.
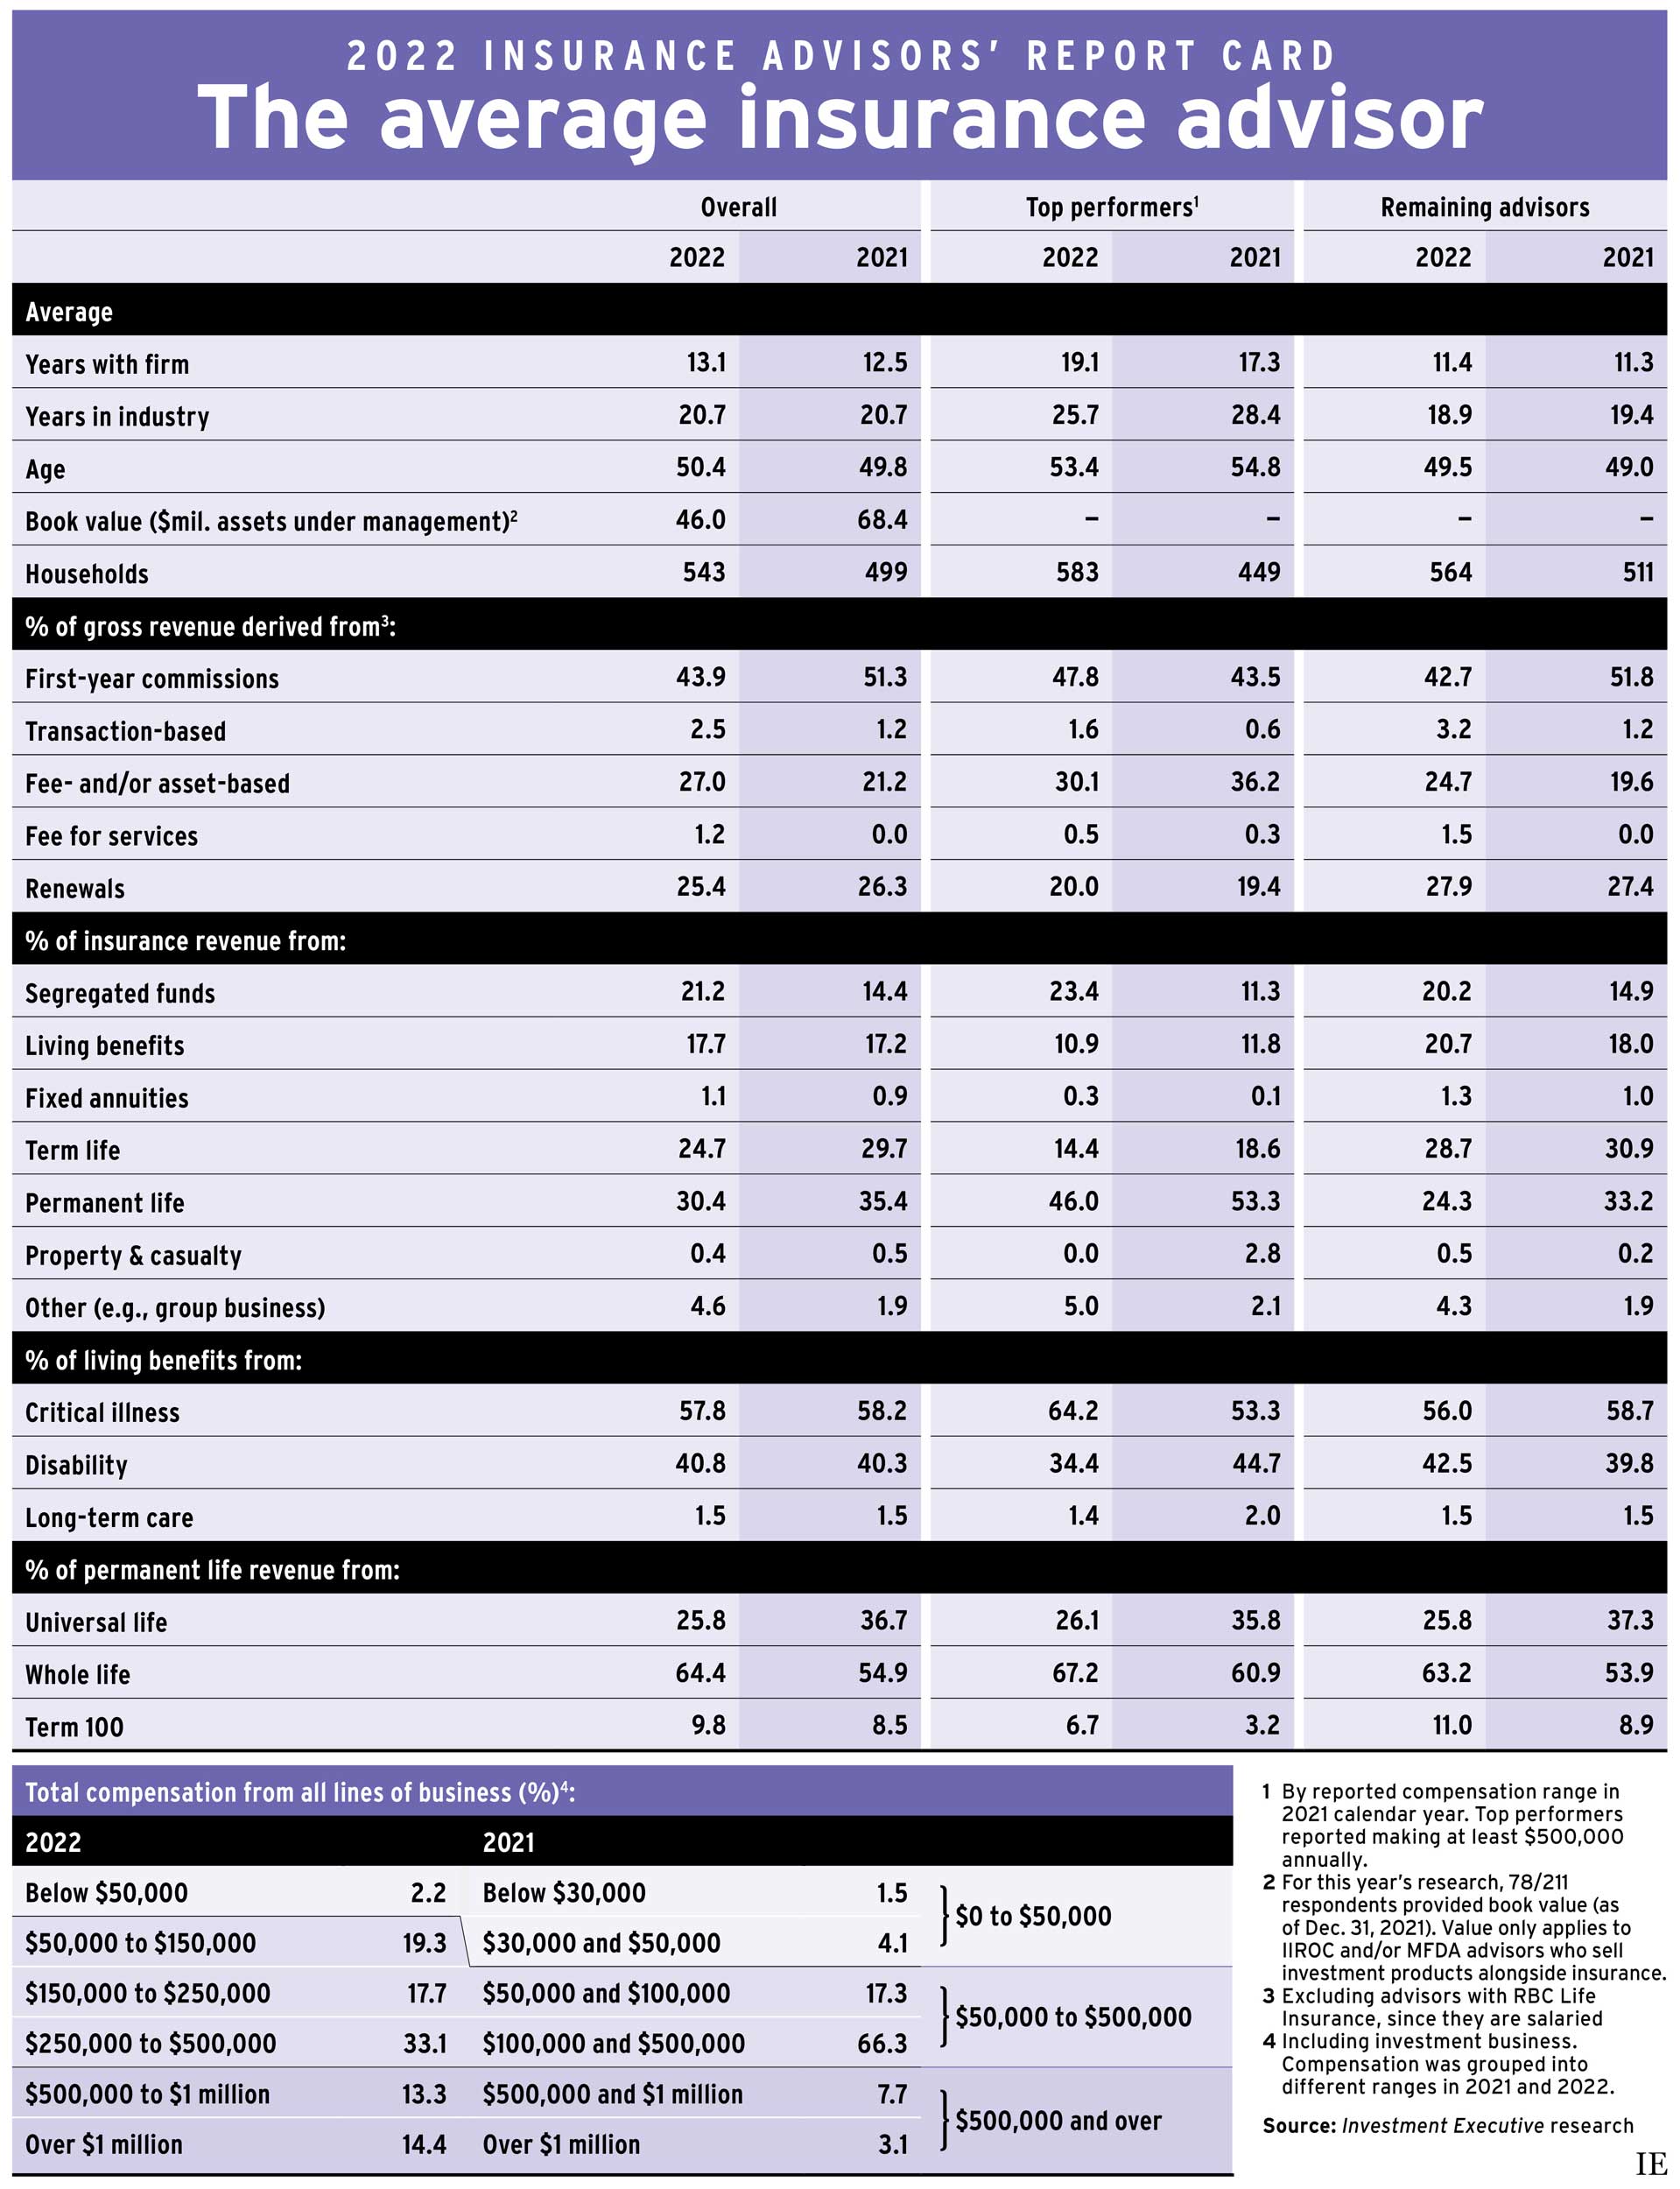
The number of client households served by the average advisor also jumped to 543, up from 499 in last year’s research.
These changes occurred amid little change in the overall advisor population. As was the case last year, the average advisor in our survey was 50.4 years old, had been in the business for almost 21 years and had been with the same firm for the past 13 years.
Average assets under management (AUM; reported as of Dec. 31, 2021) among the advisors surveyed dropped to $46.0 million this year, from $68.4 million last year. However, for the insurance sector, client household numbers are a more useful metric, as investment assets aren’t part of the businesses of many of the advisors in our research. Therefore, a drop in average AUM may simply reflect year-over-year differences in the survey sample, rather than market or client trends.
Unlike Investment Executive’s other Report Cards, which use advisor productivity (measured as AUM per client household) to distinguish between the sector’s top performers and the rest, the IARC uses a blunter instrument — annual compensation — to segment the industry, with the top performers defined as advisors who reported earning at least $500,000 in 2021.
The proportion of top performers jumped sharply year over year. In the 2021 IARC, only 10.8% of advisors reported earning more than $500,000 (in 2020). This year, 27.7% of those who answered the compensation question were top performers.
The jump in the number of top-paid advisors was particularly striking. In the 2021 IARC, just 3.1% of advisors reported earning more than $1 million. This year, that proportion more than quadrupled, to 14.4% — which was even larger than the 13.3% who reported being in the $500,000–$1 million category (up from 7.7% last year).
Alongside these sharp increases, the number of advisors who reported being at the lower end of the income scale decreased. In the 2021 IARC, 5.6% of respondents reported making below $50,000, but only 2.2% did so in this year’s research.
The proportion who reported making between $50,000 and $500,000 also shrank year over year. That group fell to 70.1% of respondents in 2022, from 83.6% of respondents in 2021.
The top performers in this year’s IARC were younger than last year’s top performers. The average top-performing rep for 2022 was 53.4 years old, down from almost 55 years old last year. This drop was accompanied by a decrease in average industry tenure to 25.7 years from 28.4. Top-performing advisors also reported having worked at their current firm longer — 19.1 years on average, compared with 17.3 years in the 2021 IARC.
This year’s top producers also gained 30% more client households since the 2021 IARC. The remaining advisors gained only 10% more client households year over year.
Trends in revenue composition also differed between the industry’s top performers and the remaining advisors. In this year’s IARC, first-year commissions surged to 47.8% of top producers’ compensation, from 43.5% last year. For the remaining advisors, first-year commissions dropped to 42.7% of revenue this year, from 51.8% last year.
At the same time, the importance of fee- and asset-based revenue declined for the top producers (dropping to 30.1% this year, from 36.2% last year) but rose for the rest of the industry (to 24.7% this year, from 19.6% last year).
Renewals continued to account for about 20% of the top producers’ compensation, versus almost 28% for the rest of the industry.
As for product distribution, reported as percentage of revenue, both top performers and the remaining advisors reported that allocations to segregated funds increased this year, while allocations to core insurance products decreased.
For top producers, seg fund allocations more than doubled, to 23.4%, from 11.3% last year. Among the remaining advisors, seg fund exposures also were up, albeit from a higher starting point — rising to 20.2% from 14.9%.
This increased reliance on seg funds was offset by a decline in core life insurance products (term and permanent life). The industry’s top producers continued to rely much more on permanent life, but that share of advisors’ business was down to 46.0% from 53.3%. Top producers’ usage of term life also declined, to 14.4% from 18.6%.
Among lower-earning advisors, allocations to term and permanent life were more similar than they were for the top producers — but shares for both types of products decreased from last year. These advisors’ use of permanent life dropped sharply to 24.3% from 33.2% last year; term life allocations edged downward, to 28.7% from 30.9%.
Both segments of advisors increased their reliance on group and other products. Among the lower-earning advisors, for example, living benefits usage rose to 20.7% of the average book from 18.0%.
Click image for full-size chart