Given the increasing stock market volatility and heightened economic uncertainty of recent months, insurance advisors who participated in the 2018 edition of Investment Executive’s Insurance Advisors’ Report Card focused more energy on their core insurance business over the past year, leaving the investment side of their business to decline slightly.
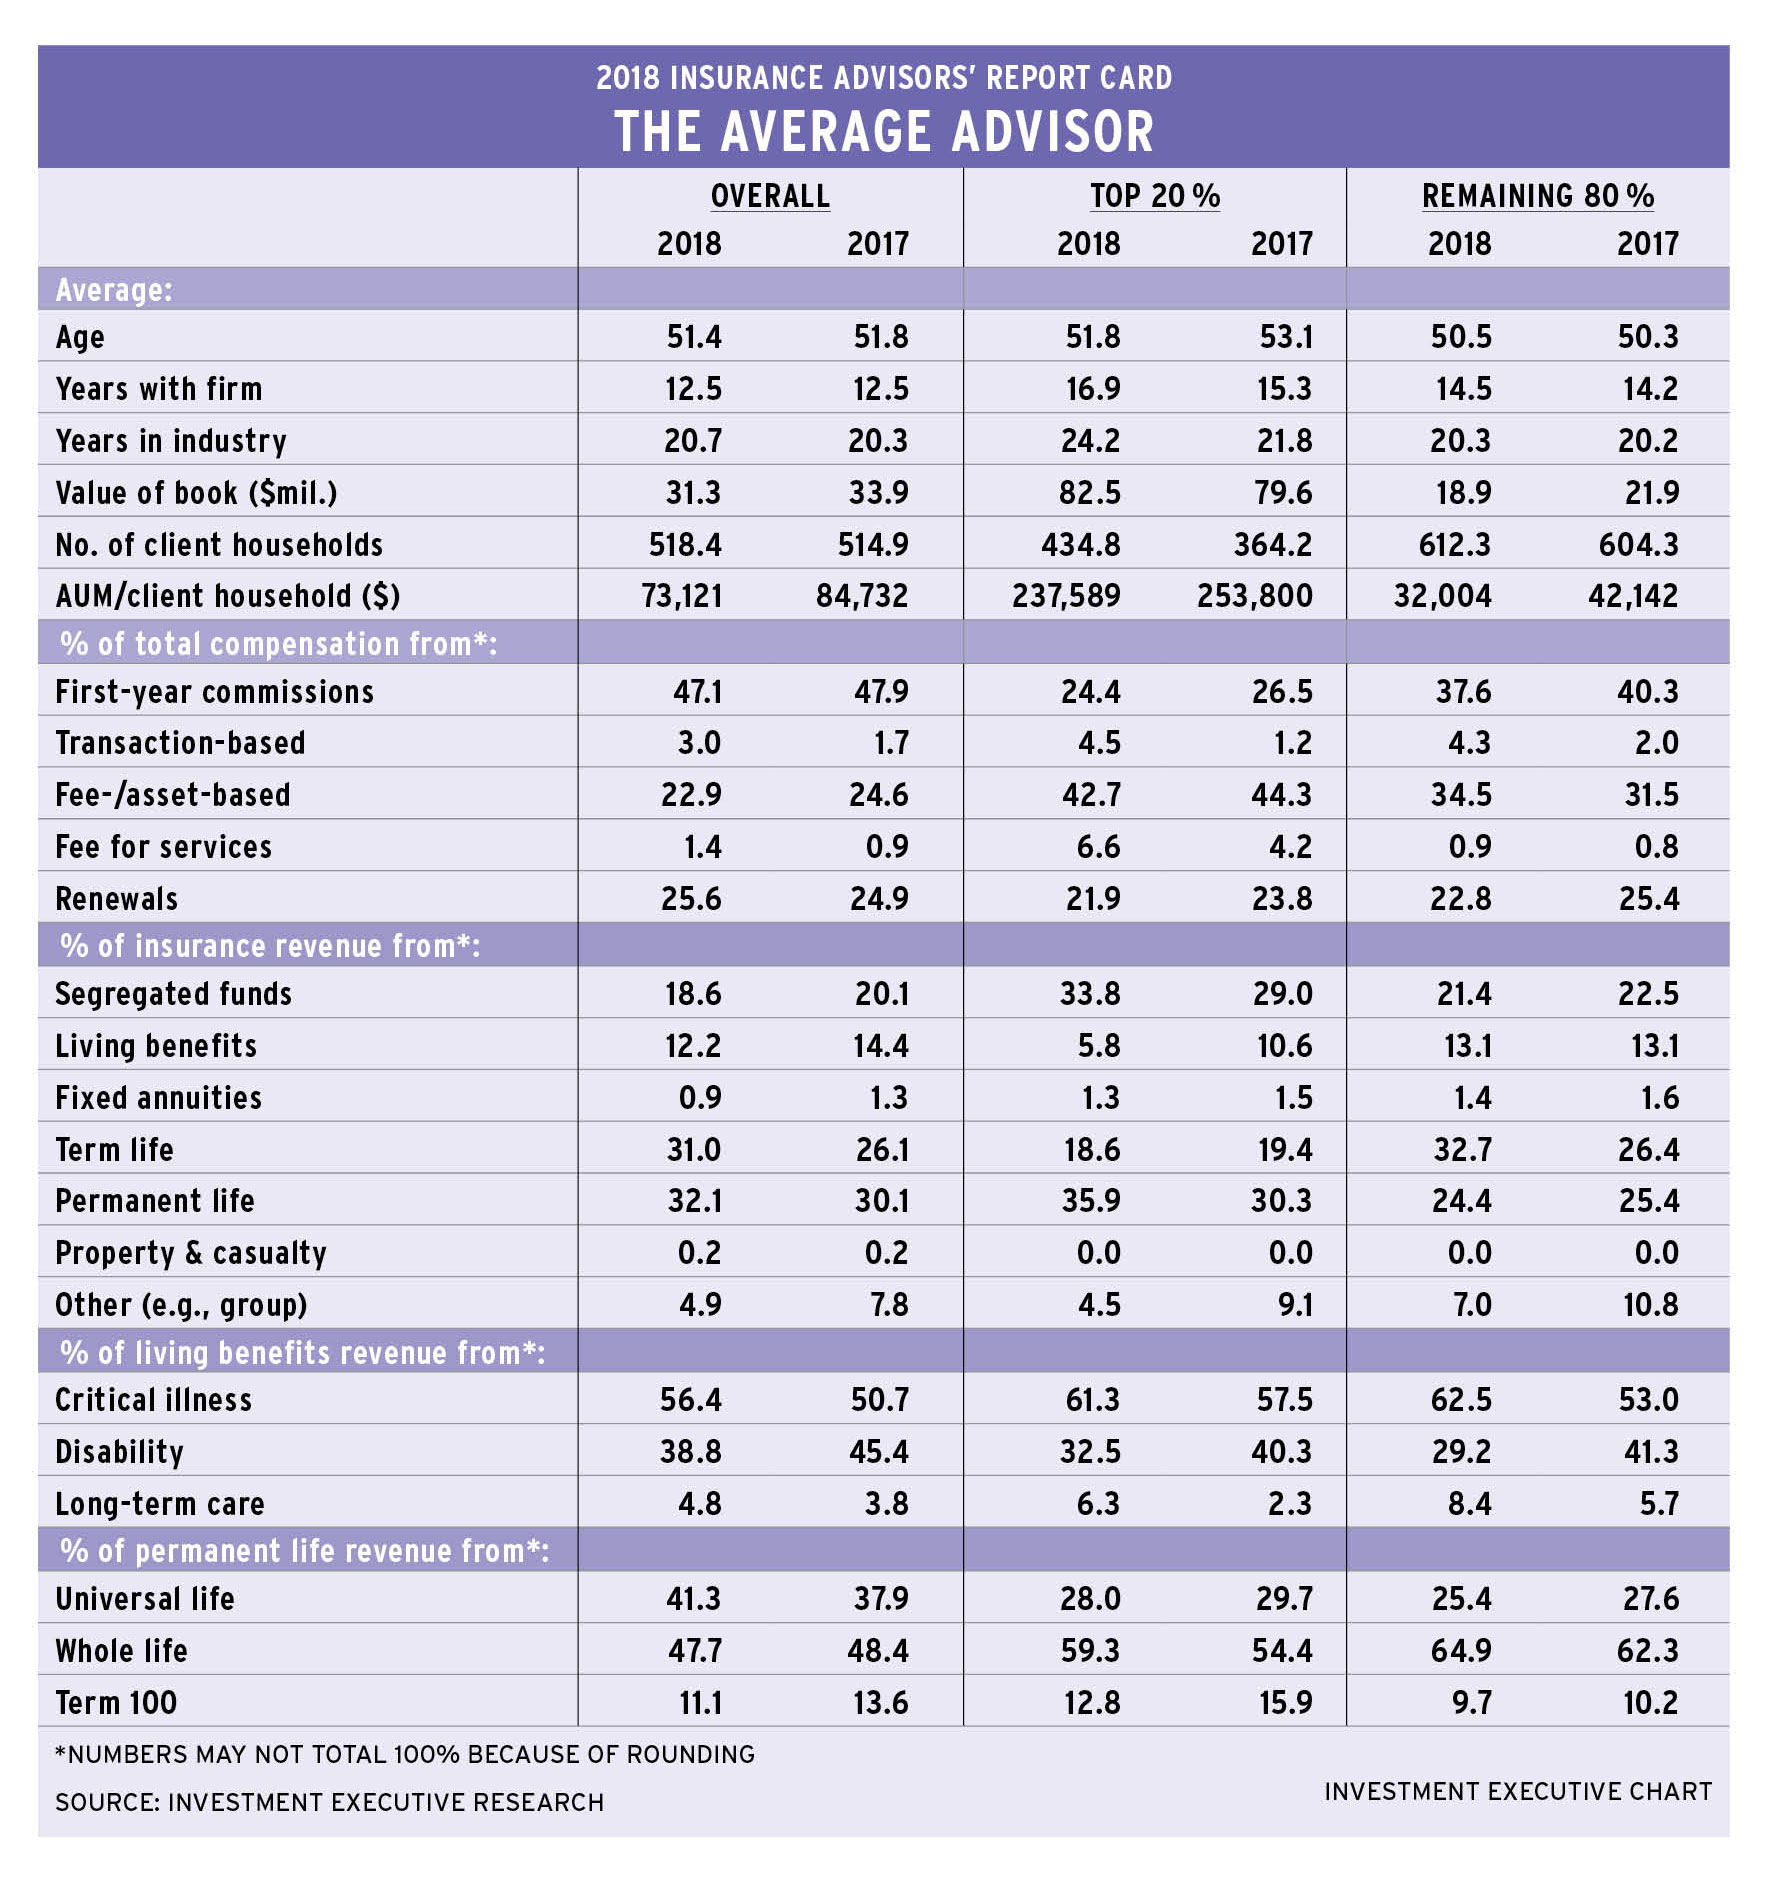
In fact, this year’s Report Card points to a modest deterioration in the average advisor’s investment business during the past year, as indicated by a drop in average assets under management (AUM) to $31.3 million from $33.9 million.
This decline in average AUM, coupled with a slight uptick in average client household figures, also resulted in a dip to average advisor productivity (as measured by AUM/client household) to $73,121 this year from $84,732 in 2017.
This productivity trend was evident for both advisor segments in the industry: the top 20% of advisors (in terms of AUM/client household) and the remaining 80% of advisors. However, the underlying factors behind the decline in advisor productivity are fundamentally different for the top 20% of advisors and the remaining 80%.
Although average productivity dropped slightly year-over-year for the top 20% of advisors, this drop was due entirely to a notable jump in the reported number of client households they’re serving on average, to 434.8 from 364.2 last year. At the same time, average AUM for these advisors also rose, to $82.5 million in this year’s survey from $79.6 million in 2017.
The picture is somewhat different for the remaining 80% of advisors. Although average productivity also dropped year-over-year for these advisors, their reported average AUM slid to $18.9 million from $21.9 million in 2017.
Despite the drop in average AUM for the remaining 80% of advisors, the number of client households served was more or less unchanged – edging upward slightly to 612.3 from 604.3 last year. So, with AUM down and client numbers remaining steady, average productivity dropped year-over-year.
Another notable difference between the top 20% and remaining 80% of advisors is evident in some of the demographic statistics. For the latter group, average age, industry experience and tenure with the current firm were essentially unchanged vs last year.
However, that wasn’t the case for the top performers. In fact, the average age for the top 20% of advisors dropped to 51.8 years old in 2018 from 53.1 in last year’s survey. At the same time, these advisors’ reported tenure in the industry rose to 24.2 years from 21.8 years, while their reported tenure with their current firms also rose, to 16.9 years from 15.3 years.
Thus, the profile of the industry’s top performers was notably distinct from the remaining 80% of advisors. And although the top performers were older than their counterparts, this difference in age was barely more than a year. The bigger difference is in their time in the business: the top performers had been working in the industry for four years longer, on average, and they had been with their current firms about two years longer.
This four-year advantage in industry tenure for the top performers translates into more time to build a book of business. And the books that the top 20% of advisors had built look much different from those of the remaining 80% of advisors.
Not only did the top 20% of advisors report a huge edge in average AUM – holding $82.5 million vs just $18.9 million for the remaining 80% of advisors – but these much bigger AUM totals were spread across client bases that are significantly smaller. On average, top producers reported serving almost 30% fewer clients than their counterparts.
This combination of much larger average AUM and notably smaller client household numbers translated into a large disparity in investment productivity. The top 20% of advisors reported an average AUM/client household that was more than seven times larger than that reported by the remaining 80% of advisors.
Of course, this comparison focuses only on the investment side of the average advisor’s book and not on the core insurance business. Indeed, the caveat to all of these data is that the analysis divides the advisor population based on investment business, not insurance. So, these data aren’t representative of the top performers’ insurance activity.
And given that the investment business is secondary for many insurance advisors, the survey sample for the top 20%, based on investment productivity, ends up being relatively small. As a result, the data on the industry’s top performers are susceptible to showing more dramatic swings from year to year than a larger sample would.
Moreover, turning back to the total population of advisors surveyed for this year’s Report Card, the data show that the advisors who participated in the survey focus more on their insurance business.
For example, looking at the 2018 product distribution data, allocations to segregated funds dropped to 18.6% of the average book from 20.1% in last year’s survey.
At the same time, advisors reported increased reliance on the two major life insurance product categories: permanent life and term life.
These two primary product categories continued to lead the way among advisors overall, and that lead is growing. Permanent life remained the top product, with a 32.1% share of the average book, up from 30.1% last year. Term life accounted for 31% of the average advisor’s business, up from 26.1% last year.
Within the permanent life category, the data also show that whole life continued to hold an edge over universal life in the average advisor’s book. This year, advisors reported that 47.7% of their permanent life revenue was derived from whole life on average, down slightly from 48.4% last year. Meanwhile, universal life accounted for 41.3% on average, up from 37.9% in 2017. The market share for term 100 dropped a bit to 11.1% from 13.6%.
However, the book composition picture differed between the two segments of the advisor population. For example, the top 20% of advisors reported that their use of seg funds rose to 33.8% of the average book this year from 29% in 2017. For these advisors, permanent life remained the most popular product, overall, with their reported allocation to these products rising to 35.9% from 30.3% last year. Term life remained in a distant third place, slipping to 18.6% from 19.4% in 2017.
For the remaining 80% of advisors, term life remained the top product, as advisors reported that 32.7% of their books were held in this product, up from 26.4% in last year’s survey. Permanent life ranked second, with a 24.4% share, down slightly from 25.4% last year. And seg funds sat third among this segment of the advisor population, at 21.4% vs 22.5% in 2017.
The fundamental differences between the top producing advisors and the remaining 80% also are evident when looking at the composition of compensation.
The bigger role for investment products among the top 20% of advisors translated into a much different revenue profile. For example, top performers were much more reliant on fee- and asset-based sources of revenue and much less on first-year commissions compared with the remaining 80% of advisors.
In fact, for the top 20% of advisors, fee- and asset-based sources contributed the single largest chunk of their compensation, at 42.7%. Although this amount dropped slightly from the 44.3% reported last year, this compensation source stayed well ahead of the 34.5% of revenue that the remaining 80% of advisors reported from fee- and asset-based sources, even though that percentage rose from 31.5% in last year’s survey.
Conversely, first-year commissions remained the largest revenue source for these advisors, accounting for an estimated 37.6% of their compensation. This percentage dropped a bit from last year, when first-year commissions reportedly contributed 40.3% of revenue. However, these commissions remained much more important to the remaining 80% of advisors than they did to the top 20% of advisors, who reported deriving only 24.4% of their revenue from first-year commissions.
This distinction is even sharper when the top 20% of advisors are compared with the industry overall. That’s because figures for the overall population included responses from advisors who focus exclusively on insurance and don’t have a book of investment business at all.
For the overall advisor population, first-year commissions still made up almost of half of revenue (47.1%), on average, whereas fee- and asset-based sources contributed only 22.9% of revenue.
These large distinctions between the top 20% of advisors and the overall advisor population highlight the diversity of business models in the insurance industry.