This article appears in the September 2022 issue of Investment Executive. Subscribe to the print edition, read the digital edition or read the articles online.
Heading into 2022, bank-based financial advisors and planners enjoyed tremendous book growth.
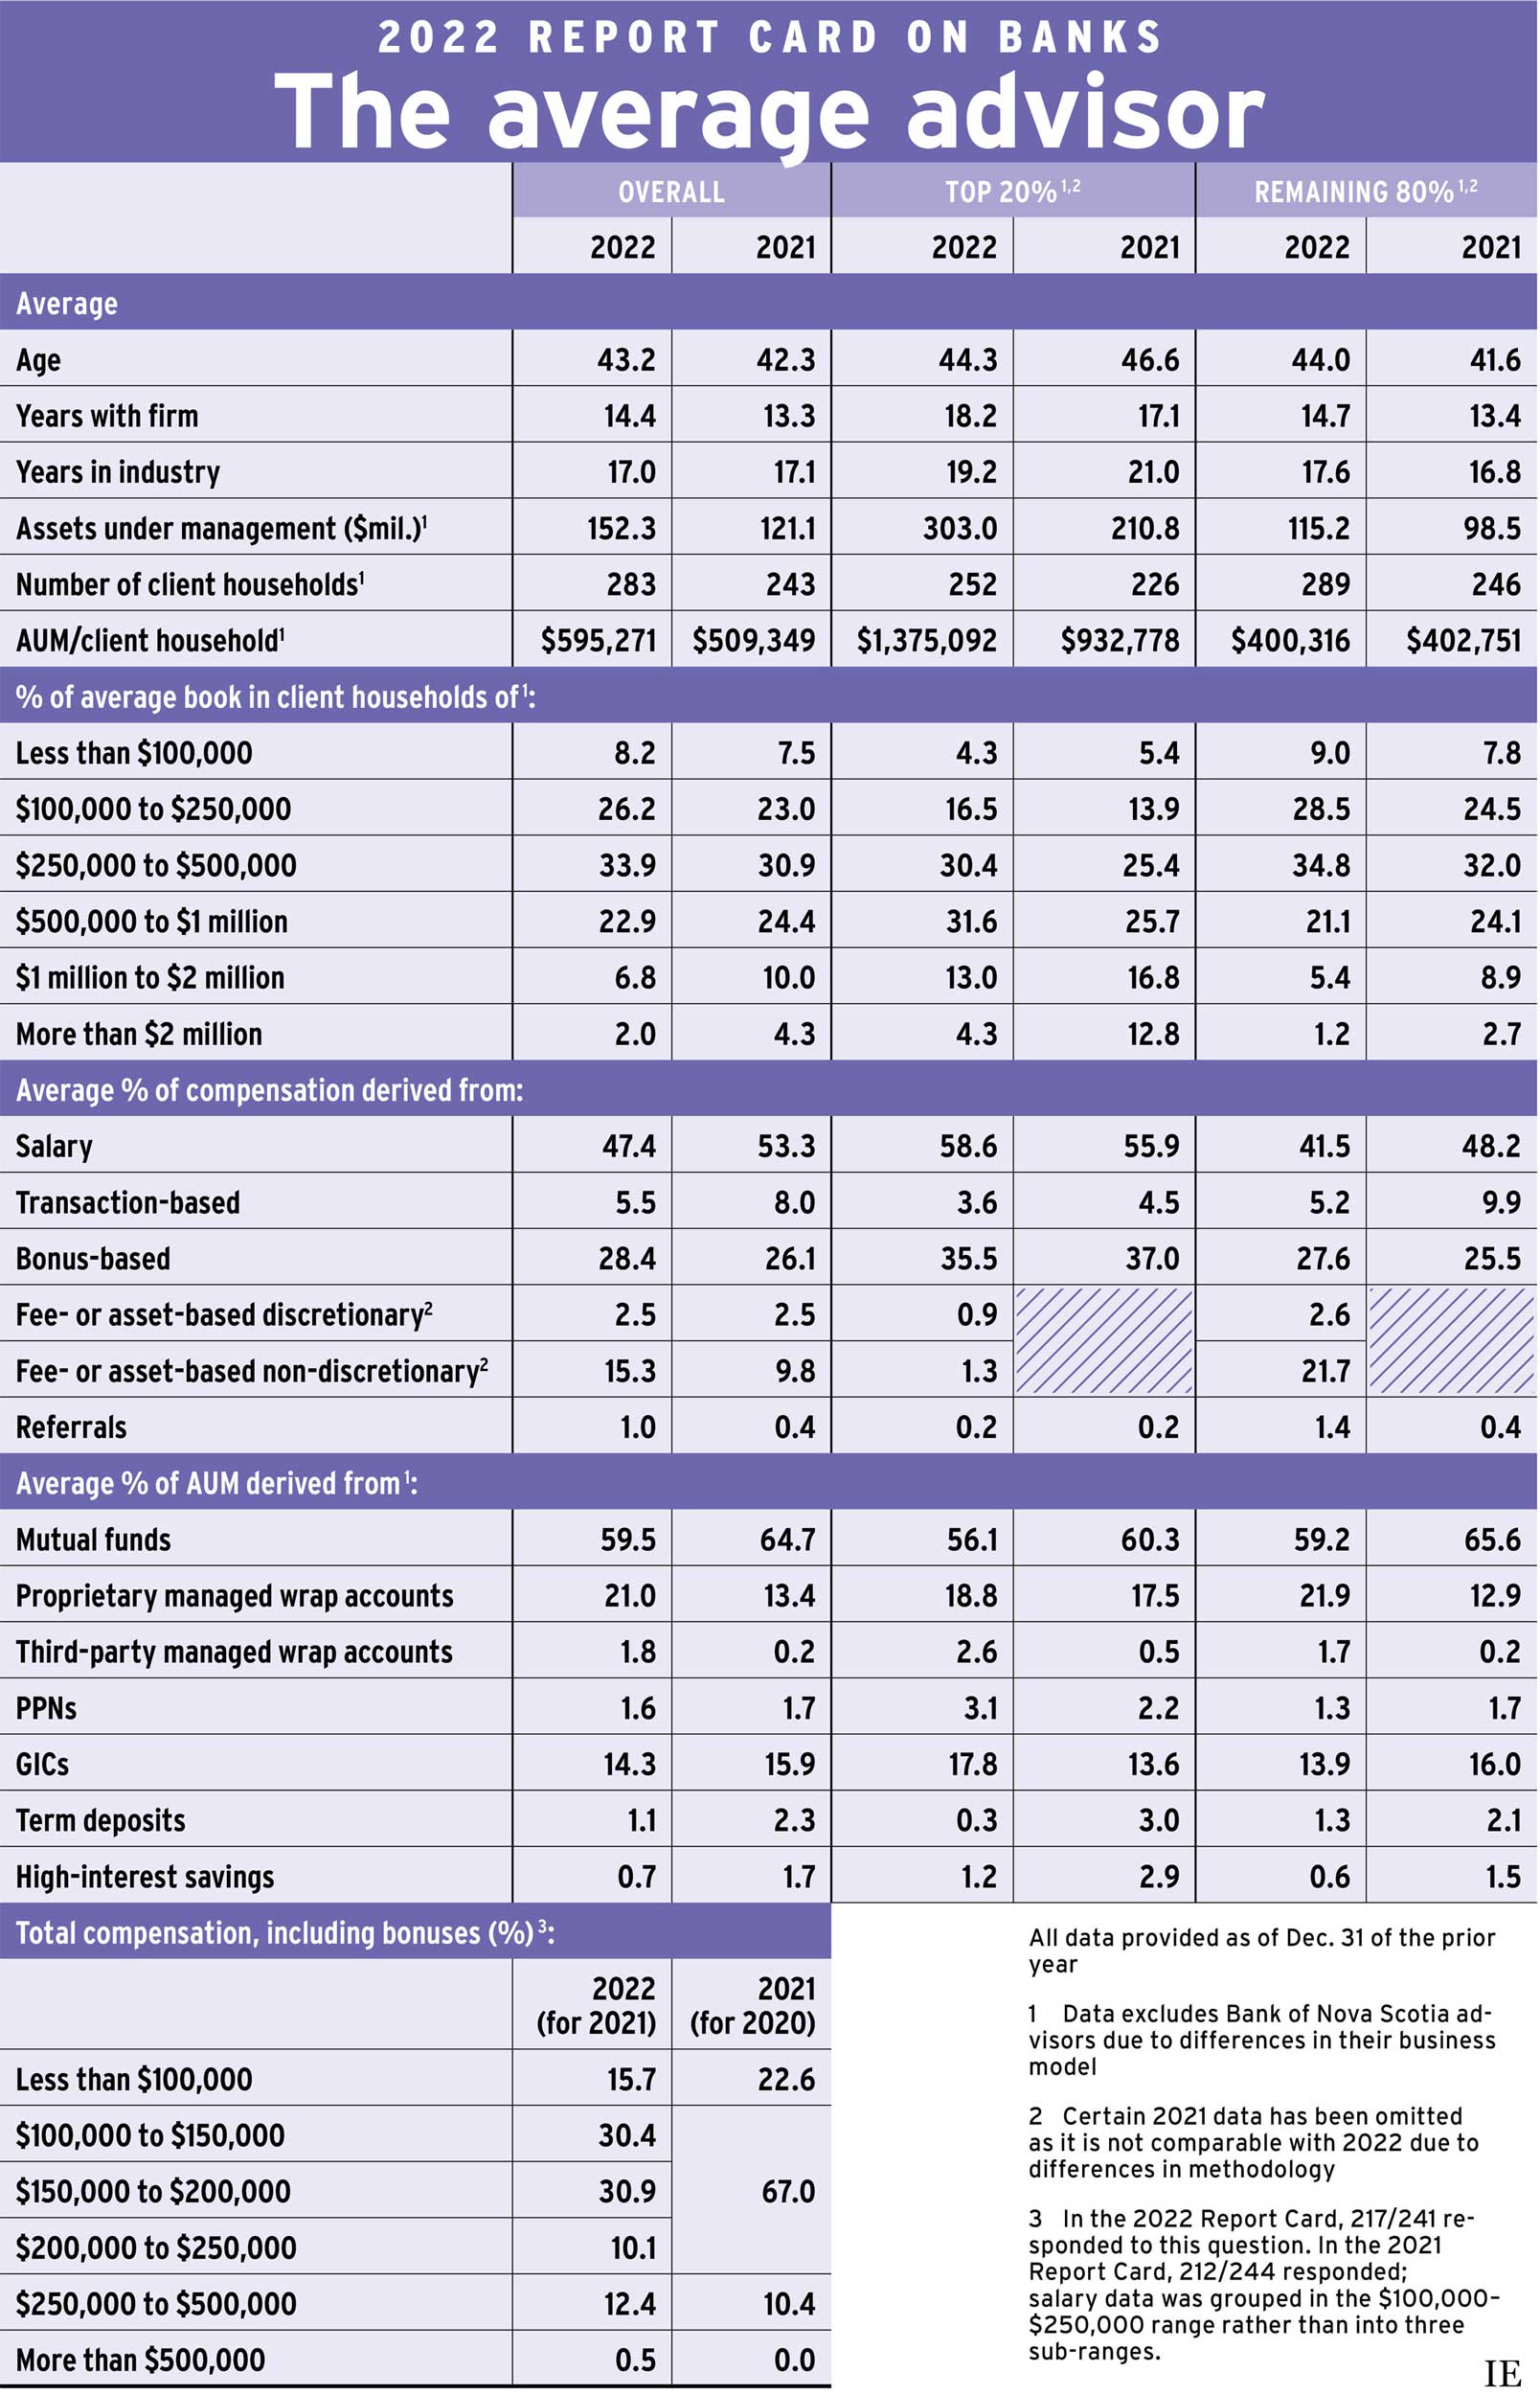
The 2022 Report Card on Banks revealed that bank-based advisors reported strong increases in their assets under management (AUM) as of Dec. 31, 2021, which coincided with growth in clients and productivity.
Average assets under management (AUM) was up by more than 25%, rising to $152.3 million this year from $121.1 million in last year’s Report Card. (All results relating to AUM and client households exclude those from Bank of Nova Scotia advisors due to the differences in their business model).
The average bank advisor reported serving 283 client households, up from 243 in last year’s research. With AUM growth outpacing household growth on a percentage basis, average productivity (measured as AUM/client household) increased over the past year by about 17%.
This growth makes sense given recent macro trends. Household savings rates soared during the pandemic as incomes rose (bolstered by government supports) and spending declined. Alongside this increased savings behaviour, financial asset values rose markedly — at least until early 2022.
Comparing the top 20% of bank advisors (based on AUM/client household) with the remaining 80% reveals that both segments reported asset and household growth. However, the magnitude of that growth was much greater for top producers.
The top 20% reported their average AUM surged by 43.7% to $303.0 million as of Dec. 31, 2021, from an average of $210.8 million a year prior. Some of that increase could be attributed to the increase in average number of client households, to 252 from 226, over the same period.
Nonetheless, average productivity for the top performers jumped to $1,375,092 in the 2022 Report Card from $932,778 in 2021.
For the rest of the industry, the direction of travel was the same, but the scale was much different. Among the other 80% of bankers, average AUM rose to $115.2 million from $98.5 million a year earlier. However, that 17% increase was closely matched by growth in the number of client households, which also rose by about 17%.
As a result, average productivity for the lower 80% ticked down year over year to $400,316 from $402,751.
There were other differences between the industry’s top performers and the other 80%.
Notably, the top performers we spoke to this year were significantly younger and somewhat less experienced than the top producers in the 2021 Report Card.
The average age of top performers this year was 44.3, down from 46.6 last year. Conversely, the average age reported by the other 80% of bank advisors jumped to 44 years from under 42 in 2021. These opposing trends mean the average ages for top performers and the rest of the industry are about the same.
However, the top 20% now report that they’ve been in the industry for slightly more than 19 years, down from 21 years in 2021. Moreover, these advisors reported being with the same bank for more than 18 years, up from about 17 years in 2021. That suggests many have spent their entire career in one place.
For the lower 80% of the industry, average industry experience and tenure with the same firm rose by 1.3 years — essentially in line with expectations. The industry’s top producers, therefore, still have more experience than the rest of the industry, but that advantage has narrowed.
The average product mix has also shifted year over year (this data also is provided as of Dec. 31, 2021). Most notably, the reported allocation to mutual funds dropped to less than 60% from slightly less than 65% in last year’s Report Card. At the same time, market share for proprietary managed products, (i.e., wrap accounts) jumped to 21.0% in this year’s research, from 13.4% in 2021.
Among the lower 80% of advisors, allocations to in-house wrap accounts jumped to 21.9% from 12.9% over the period measured. Mutual fund allocations also slid for this group, to 59.2% from 65.6%. Allocations to an array of other banking products — principal-protected notes, GICs, term deposits and high-interest savings accounts — declined modestly.
This apparent surge in allocations to banks’ in-house wrap account products comes in the wake of banks curtailing the ability of advisors to sell third-party products directly, partly in response to the client-focused reforms. An Ontario government task force f lagged that curtailment, which was subsequently the subject of a regulatory review (see Banks stand firm on cutting product shelves).
As economic and financial market conditions continue to shift dramatically in 2022, retaining any book value gains will surely be the industry’s top challenge in the years ahead. If asset-allocation choices can help bank advisors meet that challenge, the trend in favour of proprietary products may intensify.
Click image for full-size chart