As significant regulatory, competitive and market forces continue to affect the retail investment industry, the mutual fund dealer business remains a paragon of stability at first glance. Yet, the placid surface conceals significant forces at work.
The 2018 edition of Investment Executive’s (IE) Dealers’ Report Card reveals an advisor channel that’s generating modest, positive growth in key metrics, such as assets under management (AUM) and productivity. But beneath this stable, top-line growth, signs of an evolving industry are evident in the form of shifting revenue sources and asset- allocation trends.
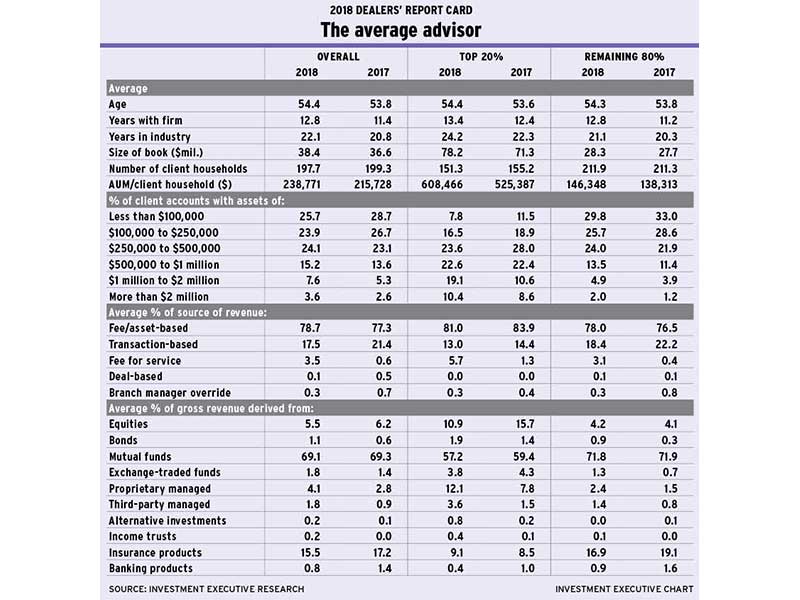
According to the results of this year’s Report Card, average AUM among these financial advisors surveyed rose slightly to $38.4 million from $36.6 million year-over-year. At the same time, client household numbers barely budged from last year. This combination of factors resulted in greater average productivity (as measured by AUM/client household) – i.e., $238,771 this year vs $215,728 in last year’s survey.
These gains in productivity for the average advisor also were reflected in the account distribution data, which indicate that accounts worth less than $250,000 now comprise a smaller proportion of the average book of business, whereas all account categories above the $250,000 mark now have captured a larger share of the average book.
The sub-$100,000 category still is the single largest account category, representing 25.7% of the average book; but that figure dropped from 28.7% last year. And the $250,000-$500,000 range now is the second-most popular account category, with a 24.1% share, edging out the $100,000-$250,000 range, which now comprises 23.9% of the average book.
These trends toward higher AUM totals, enhanced productivity and higher-value client accounts, were particularly pronounced among the channel’s top-performing advisors. (IE segments advisors into the top 20% and the remaining 80% of the advisor population, as measured by average productivity.)
Average AUM among the top 20% of advisors rose to $78.2 million from $71.3 million year-over-year. This increase of 9.7% in AUM was accompanied by a modest dip in client household numbers. This indicates that the top performers are stepping up their focus on higher-value clients. In fact, the productivity data show that for these advisors, average AUM/client household rose to $608,466 this year from $525,387 in 2017.
The increase in productivity among the top performers also was reflected in the account distribution data: the share of book of accounts worth $1 million or more surged to 29.5% from 19.2% in last year’s survey. Most of that increase was for accounts that fall into the $1 million-$2 million range: share of book of accounts in this range almost doubled to 19.1% this year from 10.6% in 2017.
At the same time, share of book of the very largest accounts (worth more than $2 million) also rose this year, indicating that the growth in the $1 million-$2 million category is not the result of a decline in AUM among the wealthiest clients.
Instead, top-performing advisors reported that share of book of smaller accounts, particularly those worth less than $500,000, dropped year-over-year. Among the top 20% of advisors, accounts worth less than $500,000 now account for less than half of the average book of business whereas, for the remaining 80% of advisors, these accounts make up almost 80% of their business.
Indeed, the account distribution data point to a widening gulf between the top-performing advisors and the remaining 80%. For example, accounts worth less than $100,000 now comprise 7.8% of the average top performer’s book vs 29.8% for advisors who are among the remaining 80%.
The fact that the account distribution data differ so starkly between the top 20% of advisors and the remaining 80% is underpinned by diverging top-line metrics. Although the remaining 80% of advisors enjoyed growth in both average AUM and productivity, their AUM level is much lower than it is for the top performers – as is the rate of growth.
The remaining 80% of advisors reported average AUM of just $28.3 million, up slightly from $27.7 million in last year’s survey. In addition, these advisors serve significantly more clients to achieve these AUM totals. On average, these advisors serve 211.9 client households, essentially unchanged from 211.3 a year ago. In contrast, the top performers now serve 151.3 client households, down slightly from 155.2 in last year’s survey.
In terms of productivity, the remaining 80% of advisors’ numbers trended higher. Average AUM/client household rose to $146,348 from $138,313 year-over-year. Yet, this year’s figure remains well below the top performers’ average AUM/client household – and the gap is widening.
Some of the difference between the two segments of the advisor population may stem from the fact that the top 20% have been in business longer than the remaining 80%. Although the average age of both segments is essentially the same, the average top performer has been in the industry for 24.2 years vs 21.1 years for the remaining 80%.
That’s not to say that tenure in the business is the only difference. But relative tenure does indicate that the top performers had a head start on their counterparts as far as service time is concerned. In fact, the top performers dedicated themselves to the investment industry earlier in their working lives. In contrast, the fund dealer business may have been a second or third career choice for the remaining 80% of advisors.
Despite the wide – and widening – gap between the top 20% and the remaining 80% regarding the size and composition of their books of business, one metric that is similar is sources of revenue. This year’s survey revealed growing reliance on fees and continuing decline in reliance on transactions for both segments of the advisor population.
Overall, transactions now generate just 17.5% of revenue, down from 21.4% in last year’s survey. Although fee-/asset-based revenue continues to account for the vast majority of the average advisor’s revenue – 78.7% vs 77.3% year-over-year – much of the decline in transactions appears to be the result of a big increase in “fee-for-service” arrangements among both top performers and the remaining 80%.
In last year’s survey, the top-performing advisors reported that just 1.3% of their revenue came from fee-for-service arrangements; this year, that percentage jumped to 5.7%. Similarly, for the remaining 80% of advisors, fee-for-service revenue now comprises 3.1% of revenue, up from just 0.4% a year ago.
Although fee-for-service structures still comprise a small proportion of revenue for the average advisor, this year’s survey indicates that these arrangements are growing rapidly. In part, this may be the result of intensifying regulatory interest in the industry’s compensation arrangements alongside a growing willingness among both dealers and clients to enter into relationships that charge directly for services and advice rather than relying on the traditional bundled charging model. (See story on page 13.)
In terms of asset allocation, mutual funds remain, far and away, the dominant asset class for advisors, accounting for 69.1% of the average advisor’s business (essentially unchanged from last year). Despite efforts to open up the ETF marketplace to fund dealers, ETFs remain a relatively marginal component: rising to 1.8% of the average advisor’s book from 1.4% last year.
In fact, the use of ETFs among the top performers actually declined slightly to 3.8% from 4.3% last year. However, for the remaining 80% of advisors, use of ETFs rose to 1.3% this year from 0.7% in 2017.
For the top performers, proprietary managed products are gaining favour. In fact, 12.1% of top performers’ books now are allocated to proprietary managed products, up from 7.8% in 2017. And use of third-party managed products also jumped to 3.6% of revenue from 1.5% last year.
The remaining 80% of advisors also increased their reliance on managed products year-over-year, albeit at lower levels. Revenue from proprietary managed products rose to 2.4% from 1.5% and third-party managed products increased to 1.4% from 0.8% in last year’s survey.