This article appears in the June 2021 issue of Investment Executive. Subscribe to the print edition, read the digital edition or read the articles online.
The Canadian mutual fund sector came through 2020 with flying colours, but the picture wasn’t as rosy for fund dealers included in Investment Executive’s 2021 Dealers’ Report Card. The books of many advisors seemed to be under pressure, even as the fund industry delivered headline growth.
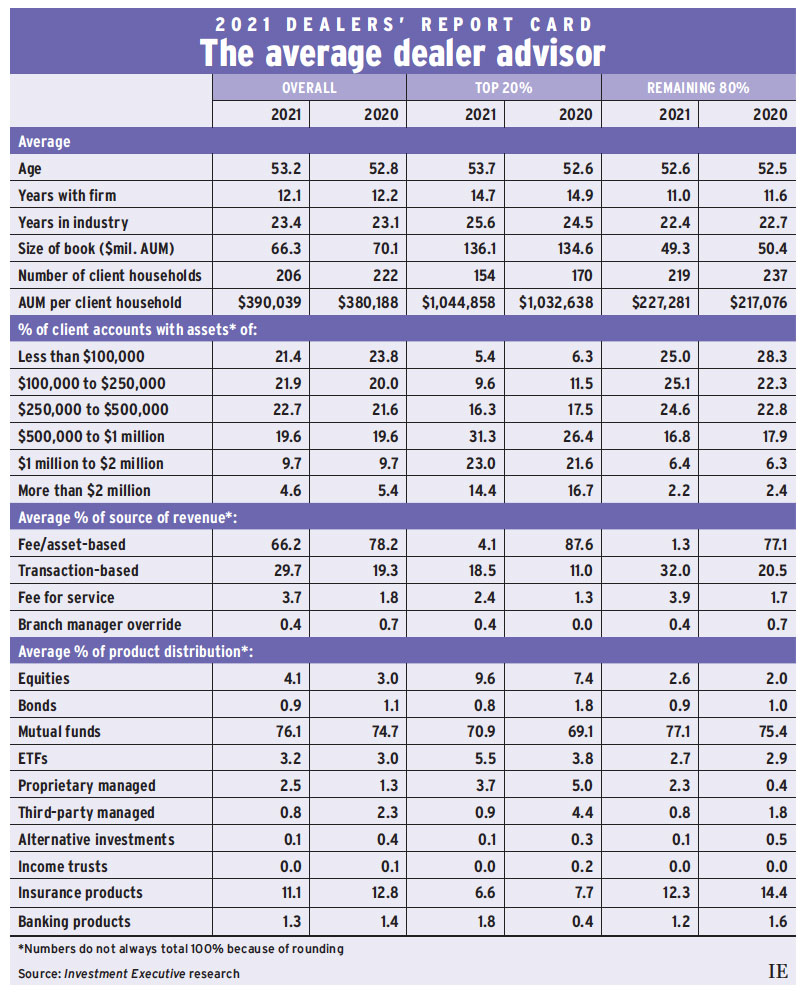
While equities markets made gains over the past year and fund assets rose handsomely, average assets under management (AUM) were down among the advisors surveyed for this year’s Report Card. Average AUM (as of Dec. 31, 2020) declined by about 5.4% year over year to $66.3 million, down from $70.1 million.
This decline stands in stark contrast to the results from the manufacturing side of the business. According to data from the Investment Funds Institute of Canada, overall industry AUM rose by about 11% in 2020. Market gains accounted for the bulk of that increase. However, asset growth proved elusive for the average dealer advisor.
Client household numbers also fell. The average advisor reported serving 206 households, down from 222 in last year’s research. This drop meant that average productivity (as measured by AUM/client household) held up — in fact, average productivity ticked up to $390,039 this year from $380,188 in 2020.
For the top 20% of advisors (in terms of AUM/client household), average productivity edged higher, to $1.04 million this year from $1.03 million last year, as the average number of client households dropped to 154 from 170.
Productivity for the remaining 80% of advisors also increased, reaching $227,281 this year and up from $217,076 last year, as the average client household roster fell to 219 from 237.
The industry’s top performers recorded a small year-over-year increase in average AUM: average assets increased 1.2% to $136.1 million, up from $134.6 million the previous year. For the other 80% of advisors, average AUM slipped to $49.3 million from $50.4 million.
Advisors’ allocations to the smallest client accounts (less than $100,000) was 21.4% in this year’s Report Card, down from 23.8% last year. There also was attrition at the high end of the client account scale: the share of accounts worth more than $2 million edged down to 4.6% from 5.4%. This shift may reflect advisors losing high-net-worth clients, or top-end clients may have pared back the share of their assets held by fund dealers.
This decline was more significant for the industry’s top performers. Accounts worth more than $2 million were rare to begin with, representing just 4.6% of the average book overall (compared with 5.4% last year). Yet, the top 20% of advisors saw their share of the largest client accounts drop to 14.4% from 16.7%.
Notwithstanding the decline at the highest end of client accounts, top-performing advisors’ books continued to shift toward higher-value accounts. The $500,000–$1 million category remained the largest allocation for top performers, rising to 31.3% this year from 26.4% last year. The $1 million–$2 million range also edged up to 23% from 21.6%.
For the remaining 80% of the industry, there also was evidence of a shift toward higher-value clients. The share of these advisors’ books allocated to the smallest accounts declined to 25.0% this year from 28.3% last year.
Sub-$100,000 accounts are no longer the largest portion of the average book among the remaining 80% of advisors. That honour now goes to accounts in the $100,000–$250,000 range, which made up 25.1% of their books in 2021, up from 22.3% last year. Accounts in the $250,000–$500,000 range also rose to 24.6% from 22.8% of the average book for these advisors.
In terms of asset allocation, there were notable differences between the top-performing advisors and the rest of the industry. For instance, the top 20% have ramped up their use of ETFs.
While mutual funds remain most popular for fund dealer advisors generally — the average overall allocation to mutual funds edged higher this year to 76.1%, up from 74.7% — top producers saw the portion of their books devoted to ETFs rise to 5.5% this year, up from 3.8% last year. Among the other 80% of advisors, however, ETF usage remained essentially unchanged at 2.7%, down from 2.9%.
The top-performing advisors also sharply curbed their reported use of managed products. In last year’s Report Card, 9.4% of their books were in managed products such as proprietary and third-party wrap accounts. This year, that’s down to just 4.6% of the average top performer’s book. This, coupled with top performers’ increased exposure to ETFs and to equities (up to 9.6% this year from 7.4% last year), suggests the top 20% have increasingly sought more cost-effective investment vehicles for their clients.
The same trend hasn’t emerged for the other 80% of advisors. For them, managed products remained a very small portion of the average book at 3.1%, compared with 2.2% a year ago.
The one area where the top 20% lagged the rest of the industry was in environmental, social and governance (ESG) assets — a category asked about for the first time in this year’s Report Card. Top performers reported 14.0% of their book involved ESG exposure, while the other 80% reported 17.7% ESG exposure, slightly above the 17.3% average for all respondents.
Click image for full-size chart