As noted in previous report Cards, the axiom that “a rising tide lifts all boats” has been true for the advisors surveyed in this year’s Report Card series. Assets were up impressively throughout the retail investment business, and advisor compensation surged, too.
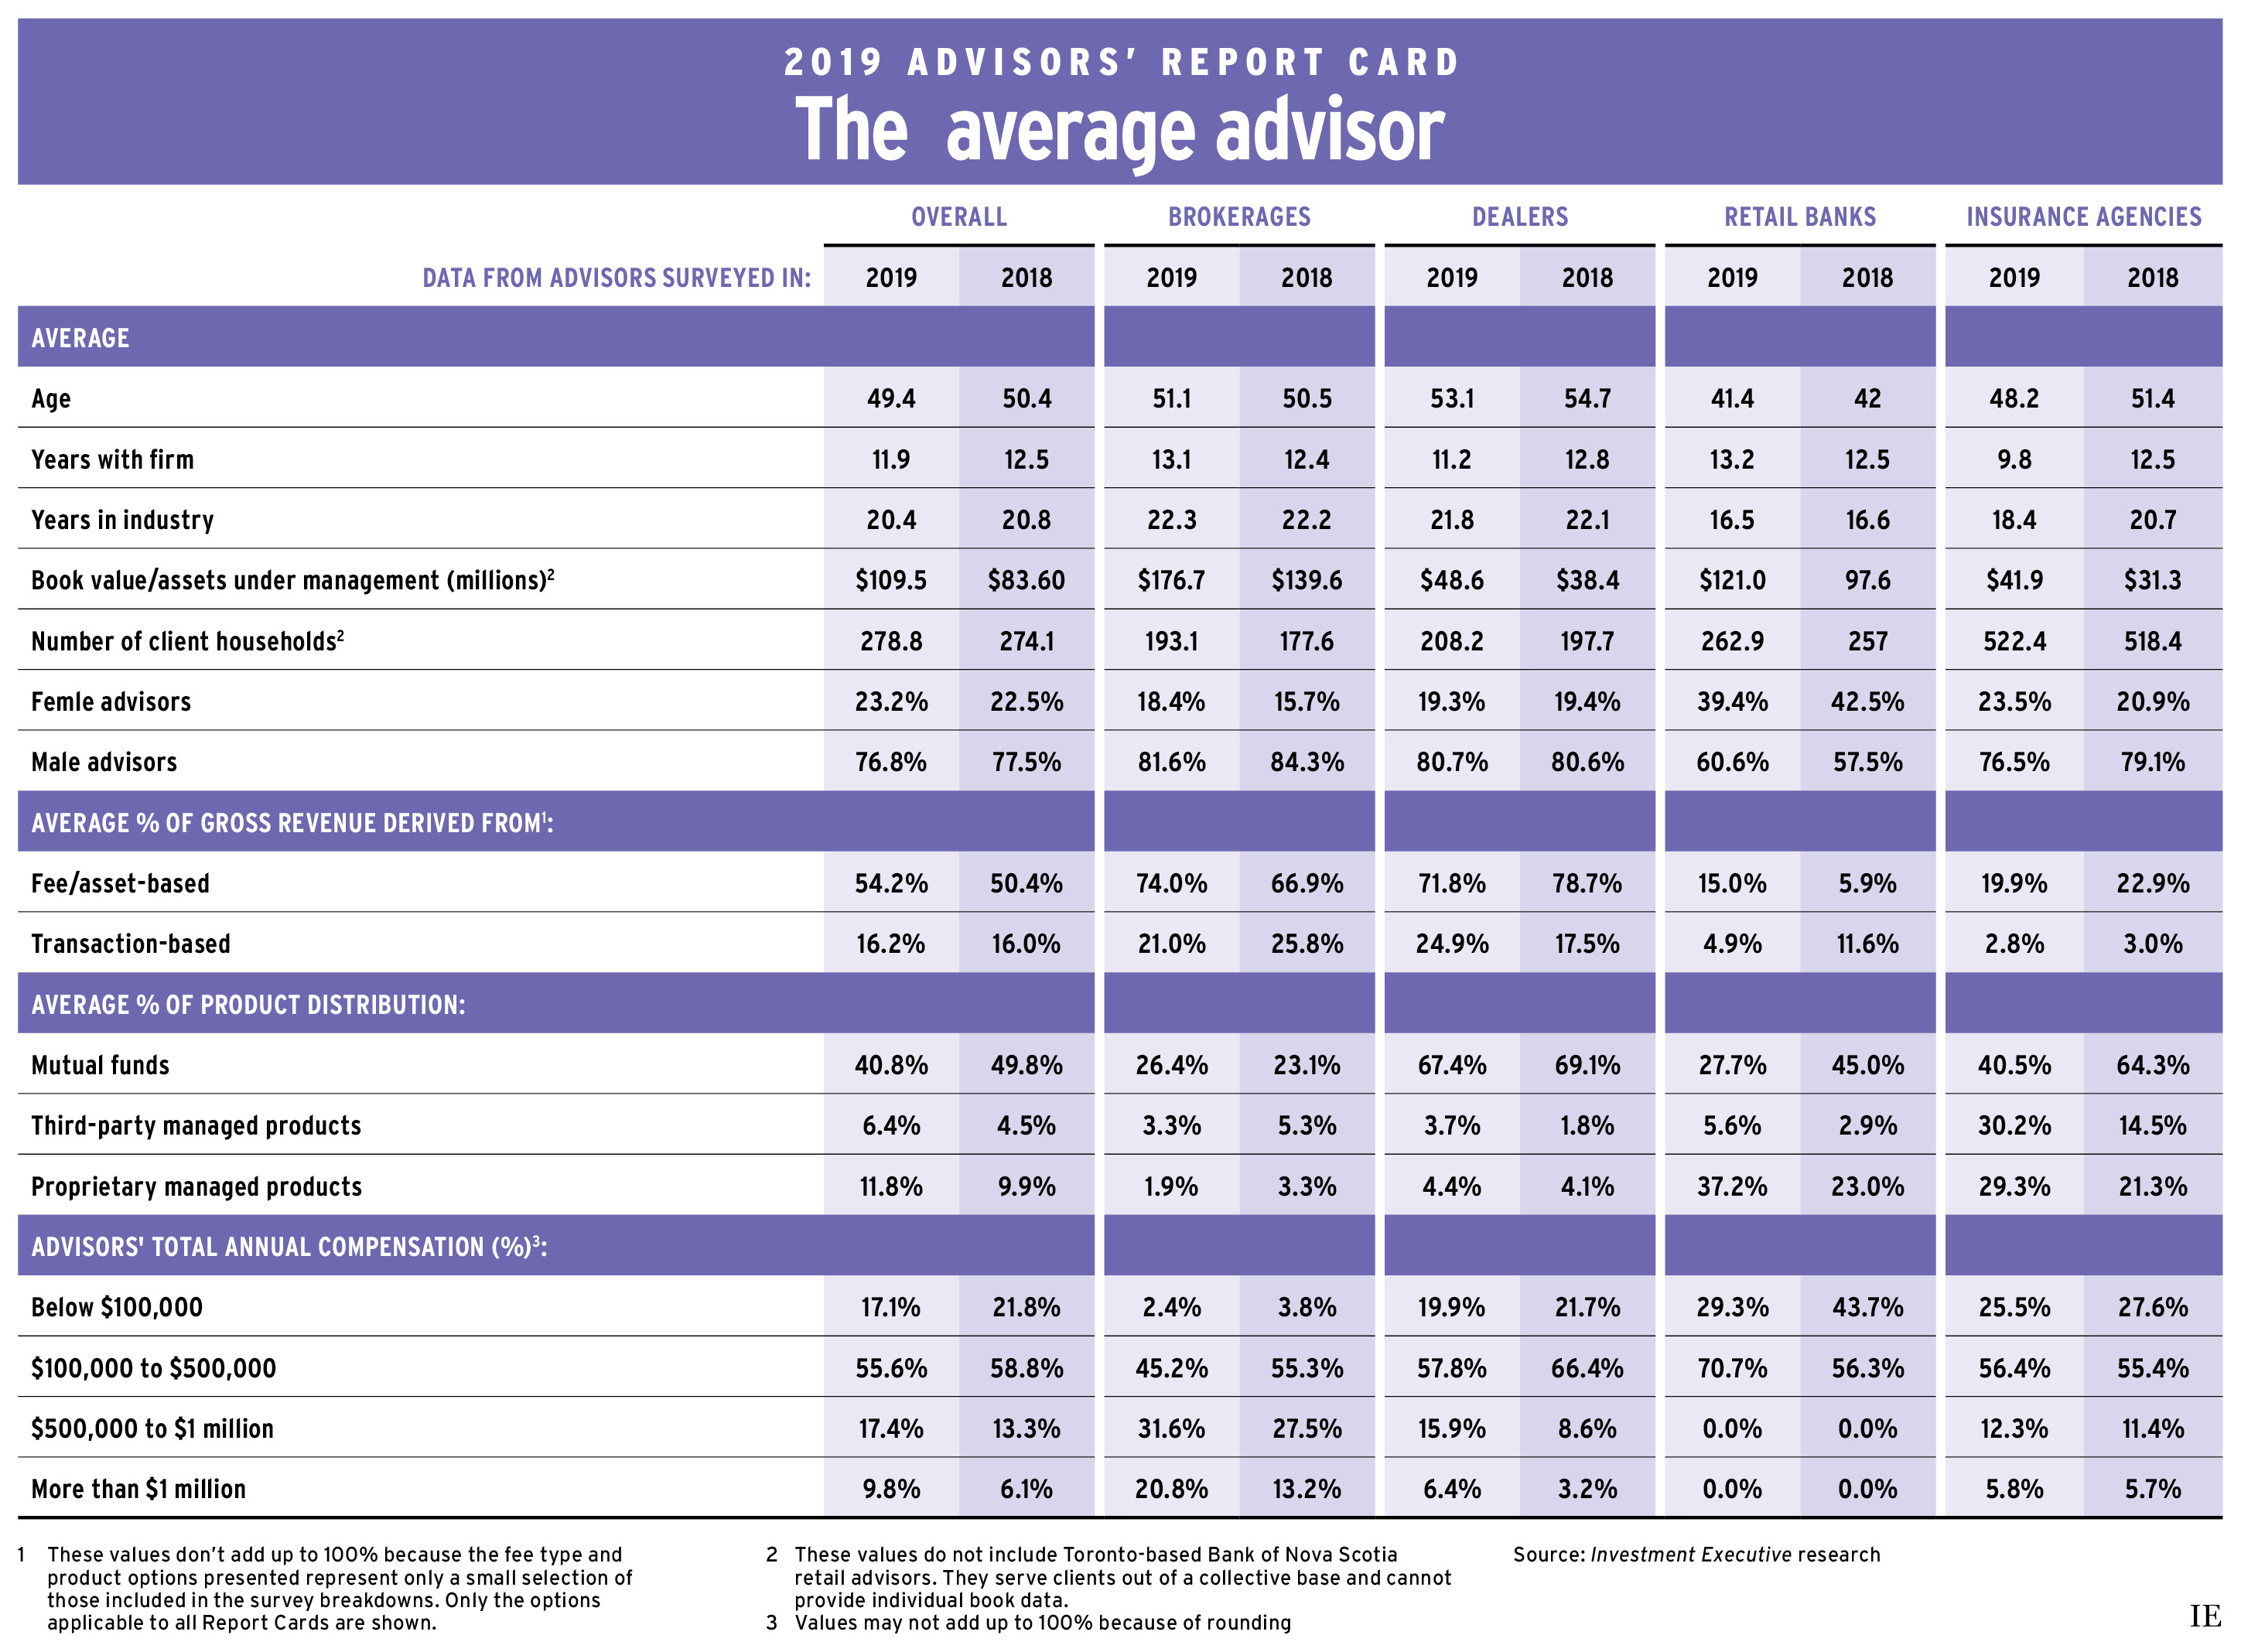
Across the Report Card series – which, as in past years, included brokerage, fund dealer, retail bank and insurance advisors – assets under management (AUM) rose by about 30% year-over-year. Overall average AUM jumped from $83.6 million a year ago to $109.5 million this year. (See methodology note, page 20.)
Since all segments of the industry reported robust year-over-year asset gains, no segments flourished at the expense of the others.
Click the image below to download a full-size version of the chart.
Instead, a variety of external forces likely drove the AUM increase throughout the industry, including market gains, rising client wealth, a shift to financial assets from real assets and the addition of new clients.
While average client household numbers rose a bit from last year, the increase was well below the rate of asset growth. Across all facets of the industry, average client household numbers rose only slightly, to 278.8 from 274.1 last year.
However, there was variation among the four industry segments. The brokerage segment saw the fastest growth in client household numbers, with client rosters growing almost 9% year-over-year – though that doesn’t explain the segment’s nearly 27% gain in assets over the same period. Conversely, there was barely any change in the bank and insurance segments (both saw household growth of no more than 3%).
Accompanying this general growth was data pointing to an increase in the number of advisors entering the business. The average age of respondents surveyed was 49.4 years, down from 50.4 in 2018.
The decrease in average age came alongside modest declines in the length of time that respondents reported having worked in the industry (down slightly to 20.4 years in 2019 from 20.8 years a year ago). There was also a dip in average tenure at advisors’ current firms, declining to 11.9 years from 12.5 years in 2018.
The drop in average advisor age occurred across most of the industry, with the brokerage sector being the only exception. The insurance segment saw the most significant dip in advisor age, with the average respondent saying they were 48.2 years in 2019 vs 51.4 years old in 2018.
The changing composition of the industry wasn’t just evident in the demographics of the advisor population: it was also reflected in shifting product mixes.
When asked to think about the products they sell by percentage of AUM, the advisors surveyed for the 2019 Report Card series indicated that, overall, their allocations to mutual funds were down. The funds accounted for just under half of the average book in 2018 (49.8%) and composed only 40.8% in 2019.
Even the fund dealer segment reported that its usage of mutual funds dipped compared with last year (to 67.4% from 69.1%). But, among retail bank and insurance advisors, the drop over the same period was much larger: there was a dip of 17.3% for the former and 23.8% for the latter.
The sole exception to this trend was the brokerage segment, where mutual fund usage ticked up a bit from last year. Advisors in this area already reported the lowest allocations to mutual funds, but that stood at 26.4% in 2019 vs 23.1% a year ago.
The decline in mutual fund allocations doesn’t necessarily signal a stampede away from these products. Instead, it may simply reflect the fact that the large asset inflow the industry has enjoyed over the past year also favoured other sorts of products.
While mutual funds had a smaller share of the average book in this year’s surveys, the average advisor’s book is so much larger that the dollars allocated to mutual funds could still have grown over the past year. The nearly 41% of this year’s overall average AUM of $109.5 million put into mutual funds would be larger than the 50.4% of last year’s average AUM of $83.6 million put into mutual funds.
Moreover, the fact that mutual fund allocations increased in the brokerage sector, which boasted the largest average book size in terms of assets managed, also suggests that mutual fund allocations were likely up year-over-year in dollar terms.
Other asset categories that gained significant shares of advisors’ AUM over the past year – and against the backdrop of substantial asset growth – included both categories of managed products (i.e., third-party managed and proprietary managed products, such managed wraps and accounts). Allocations to third-party managed products jumped from to 6.4% in this year’s Report Card series from 4.5% a year ago. Similarly, respondents’ allocations to proprietary managed products also increased, to 11.8% from 9.9%.
Once again, it’s important to be careful when interpreting this data: these percentages reflect average, unweighted reported AUM allocations across all four segments of the industry.
For example, the brokerage sector was the one area where allocations to managed products declined year over year, running contrary to the overall industry trend. Once again, this segment of the business had the largest reported book size by assets managed – by a significant margin – so the increase in dollar terms for the two managed product categories may not be as impressive as the headline percentages suggest.
Looking at respondents’ average compensation was less ambiguous. In this area, the industry trends captured were more uniform, showing higher take-home pay.
The proportion of advisors reporting that they earned less than $100,000 in the last year declined to 17.1% in 2019 from 21.8% in 2018. The share of advisors reporting compensation in the $100,000 to $500,000 range also declined year-over-year, slipping to 55.6% from 58.8%.
Across the four industry segments captured, advisors’ reported compensation levels suggested that more are likely living above the $500,000 mark. The proportion of advisors who said they’re earning between $500,000 and $1 million was up to 17.4% this year from 13.3% a year ago. And, just under 10% of respondents reported that they were earning more than $1 million per year, up from 6.1% in 2018.
This trend toward higher compensation was generally evident across all four segments, even though the results varied. In the banking segment, for example, no advisors claimed to be making more than $500,000 per year. In contrast, the share of respondents who reported being in the $100,000 to $500,000 range was up sharply this year, to more than two-thirds (70.7%) this year, from just over half in 2018 (56.3%).
In the insurance sector, the proportion of advisors in the $100,000 to $500,000 range was slightly higher this year, edging up to 56.4% from 55.4%. That said, the 2019 Report Card found a slight decline in the share of advisors earning less than $100,000, alongside a small increase in those in the $500,000 to $1 million category.
Overall, this year’s Report Card series points to evidence of robust investment industry growth, both in the AUM of those surveyed and annual compensation – a testament to the power of a rising tide in the retail investment business.
A methodology note
This year, we excluded certain book size data from Toronto-based Bank of Nova Scotia from the Report Card on Banks due to those advisors serving clients from a collective base. Those Scotiabank advisors couldn’t provide individual book data, thus preventing them from reporting accurate asset-under-management numbers or client-household data. In order to enable valid year-over-year comparisons of the aggregate Report Card data, some of the Advisors’ Report Card data for 2018 has been adjusted.