Financial advisors at Canada’s Big Six banks are back in growth mode following a year in which these banks were reeling from allegations of misconduct among their sales forces.
This year’s edition of the Report Card on Banks revealed that the average advisor reported managing a heftier, more productive book of business than a year ago. This could be interpreted as the banks being able to shake off any damage to their reputations arising from accusations of poor sales practices among their in-house advisors. (See story on page 14.)
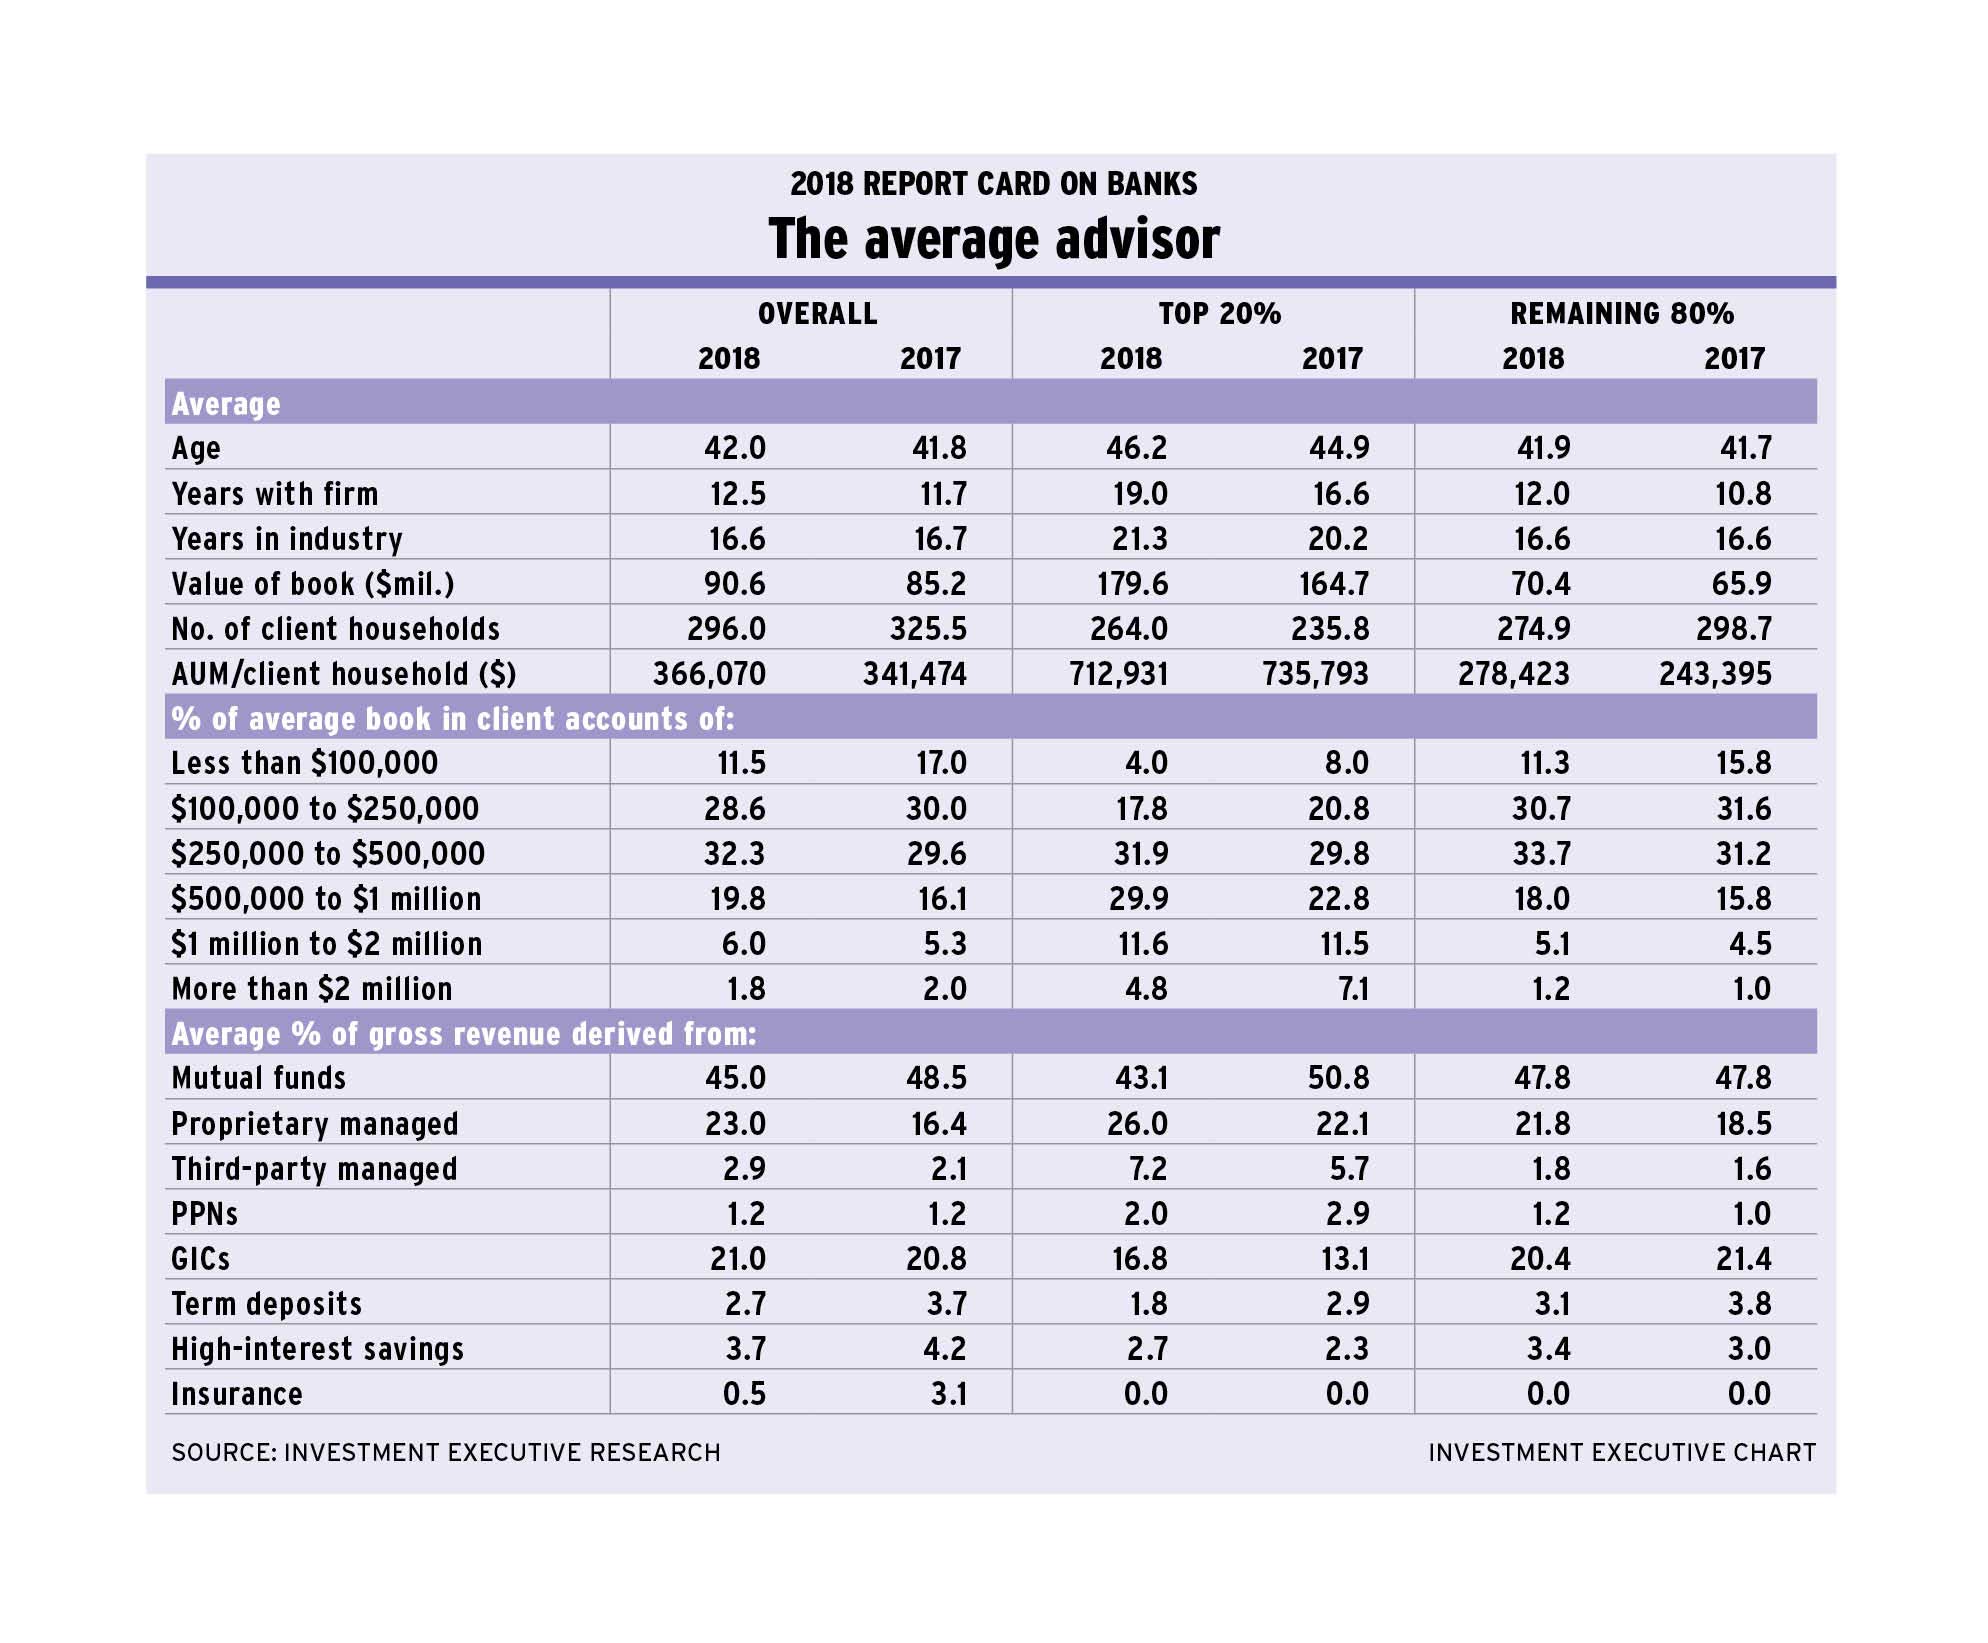
That said, the return to growth in the average advisor’s book was modest, and advisors haven’t recovered all of the ground they reported losing in last year’s survey. The average advisor now has $90.6 million in assets under management (AUM), up slightly from last year’s average of $85.2 million in AUM. Notably, the average AUM reported this year still is less than the $95 million in AUM that the average advisor reported in 2016.
So, although the banks’ advisors may have stopped the bleeding, they aren’t experiencing a big bounce-back. Instead, the modest growth in AUM more or less tracks the securities markets over the past year.
Average productivity, as measured by AUM/client household, increased at a similar rate, rising to 366,070 from 341,474 year-over-year. This shift reflects the combination of a modest increase in average AUM and a corresponding decrease in the number of client households that the average advisor serves, to 296 households from 325.5 in last year’s survey.
These trends toward higher AUM and productivity also were reflected in the account distribution data. Last year, the single largest client-account category for the average advisor was the $100,000-$250,000 range, which comprised 30% of the average book. This year, the distribution shifted a bit upmarket, with the $250,000-$500,000 range now the single largest category reported, at 32.3% of the average book.
This shift to higher-value accounts pivoted around the $250,000 mark. For the average advisor, the proportion of accounts worth less than $250,000 dropped to 40.1% from 47% in last year’s survey. At the same time, the share of book for every category above the $250,000 mark rose this year, except in the $2 million-plus category.
Although these trends indicate that advisors enjoyed a return to business growth, the demographic data suggest that the banks are experiencing some turnover in their sales forces.
The average age of advisors surveyed for this year’s Report Card was virtually unchanged from last year, at 42 years old. Furthermore, the average tenure in the industry was more or less static, at 16.6 years vs 16.7. These trends suggest that the composition of the underlying advisor population is changing as rookies enter the business and older advisors leave.
The changing composition of the sales force indicates an influx of younger advisors once the advisor population is segmented into the top 20% and remaining 80% based on their productivity. The segmented demographics of the average advisor revealed that the top performers are aging normally and that the shifting demographics are taking place among the remaining 80% of advisors.
Case in point: the average age for top producers in the survey rose to 46.2 years old from 44.9 years old year-over-year. This segment’s average tenure also increased by about a year, to 21.3 years from 20.2 years. These trends are consistent with a stable sample population that’s aging as expected and there hasn’t been an influx of younger advisors or an exodus of older ones.
In contrast, the composition of the remaining 80% of the advisor population changed on average. This is the segment of the advisor population that seemed to be infused with new blood. The average age among the remaining 80% was just 41.9 years, with 16.6 years tenure in the industry. Both of these figures were notably lower than those for the top producers and changed little from the 2017 data.
Apart from the age and industry tenure metrics, both segments of the advisor population experienced some fundamentally distinct business development trends. Both segments of advisors reported growth in AUM – although neither segment returned to the levels reported in 2016.
Average AUM among the industry’s top performers grew to $179.6 million from $164.7 million in 2017. For the remaining 80% of advisors, average AUM also increased, rising to $70.4 million from $65.9 million year-over-year.
Although growth in average AUM was a bit stronger for the industry’s top producers, their productivity declined because the average number of client households these advisors serve increased at an even higher rate than AUM. The average top performer reported serving an average of 264 client households vs 235.8 client households last year.
Conversely, the average number of client households that the remaining 80% of advisors reported serving dipped to 274.9 from 298.7 year-over-year. This combination of a drop in client households and an increase in average AUM resulted in average productivity climbing by 14.4%.
The increase in the number of client households for the average top performing advisor and the decrease among the remaining 80% of advisors means that both segments of the advisor population reported very similar client household numbers. What distinguished the top performers from their counterparts was average AUM: the top 20% of advisors reported more than double the AUM that the remaining 80% did.
This difference between advisor segments also was reflected in the account distribution data: top performers reported a much larger portion of their books is dedicated to higher-value client accounts.
For example, top performers reported 46.3% of their average book was held in accounts worth more than $500,000, vs just 24.3% for the remaining 80% of advisors. At the other end of the spectrum, just 21.8% of average top performers’ books was held in accounts worth less than $250,000 vs 42% for the remaining 80% of advisors.
One thing the segments of the advisor population share is a shift toward higher-value accounts. In last year’s survey, top performers reported that 28.8% of their book was composed of accounts worth less than $250,000 and the remaining 80% of advisors reported 47.4% below that threshold.
So, although there was a stark difference between the two advisor segments’ AUM in absolute terms this year, the trend for both is moving in the same direction: upward.
There also were some notable changes in asset allocation this year. For the advisor population, overall, the reported use of mutual funds dropped to 45% of the average advisor’s book this year from 48.5% last year. At the same time, use of proprietary managed products jumped to 23% of the average book from 16.4% last year. The use of third-party managed funds also ticked upward slightly, to 2.9% from 2.1% year-over-year.
The trend toward using proprietary managed products was reported among both segments of advisors. Allocations rose to 26% from 22.1% for the top performers and to 21.8% from 18.5% for the remaining 80% of advisors.
So, as advisors claw their way back from the drop in AUM they reported last year, a growing proportion of their books was placed in their banks’ in-house managed products. That’s a sign advisors shook off any concerns about their sales practices and that clients still trust the banks.