This year’s summary of the Investment Executive Brokerage Report Card, Dealers’ Report Card and Report Card on Banks reinforces the vital role that technology plays in today’s business. One of the top concerns among advisors and planners across those channels was the need to keep up with technology, enhancing their client service.
Five of the seven categories that make up the technology suite in the Report Card were among the research program’s top 10 areas where industry firms could most improve. Advisors rate their firms or banks across 26 categories, giving performance ratings for how well they’re supported and importance ratings for how crucial a category’s support is to them personally — an overall satisfaction gap is identified where the collective performance result lags the collective importance average, meaning advisors’ expectations aren’t being met.
“They [my firm] need to execute what [was] promised: technology and upgrading, and ensuring back office and head office are fully supportive and available to advisors,” said a brokerage advisor in Ontario. “There are major technology pieces that will be critical to [the] underlying systems we currently use,” added this advisor, who acknowledged a “system overhaul” was being conducted at their firm to fix the current “imperfect” infrastructure.
A retail bank advisor in Ontario also reflected on how some firms have hung on to legacy tools. They said their bank could improve by “updating technology” and considering more “advanced” systems. “[That means] letting go of certain structures … that are outdated,” this advisor explained, citing room for improvement in their client-facing tools, technology training and especially in the back office. (Read How software vendors roll out tech tools)
“I’ve worked in other institutions that have better support,” this advisor concluded.
The largest satisfaction gap recorded in this summary Report Card was for the “advisor’s experience with back-office tools & services” category, which had a gap of 1.3 between its performance average of 7.9 and importance average of 9.2 (that gap had only mildly improved from 1.5 in 2024).
The other technology categories with notable gaps were: “client onboarding tools,” rated 8.1 in performance and 9.2 importance (a 1.1 difference), followed by “technology training & internal IT support,” “client relationship tools” and “client account statements & portals,” all of which had satisfaction gaps of 0.9.
While firms of all sizes are spending significant amounts of time and money on upgrades for digital suites, the technology race is nearly impossible to win — especially for leaner, smaller firms. “[It’s hard to] just keep up with the latest tech,” said a dealer advisor in Ontario. However, “If you don’t have the right technology, and it changes so rapidly, you’ll be competing with banks [that have] deeper pockets.”
So, wealth firms have to try. In a new query this year, we asked advisors and planners across the channels to choose which area of the survey their firms or banks needed to pay attention to and invest in the most. The results of that ask also highlighted the value of digital advancement since the technology suite group was the second-highest choice by advisors, selected by nearly one in five (at 18.6%). It was beaten only by the firm culture group, chosen by 35% of respondents.
The bottom line? A solid, hybrid approach to client service is required. “[Good digital tools] help us run our businesses more efficiently so that we can do more for our clients. Leveraging technology to manage wealth is very important,” as is allowing some flexibility so that advisors can choose some of their own tools, another dealer advisor in Ontario said.
Compensation gaps
The technology suite isn’t the only area where advisor expectations run high.
Within the “compensation structure” and “bonus structure” categories, advisors asked for improvements. Both had a satisfaction gap of 0.7 between their collective performance and importance averages for 2025, similar to a year ago.
Retail bank advisors most strongly signalled room for improvement in their pay and bonus structure, with many concerned about changes in their pay structure that made it inconsistent and less transparent.
“It’s very complicated. … You need to decipher it,” said one retail bank advisor in Ontario about their pay structure. “They use a formula that [seems to] change every year.”
Others focused more on the impact of inflation, which affected their perception of how well their pay reflected their value. IE doesn’t ask advisors about pay levels or whether they have received raises, but they bring this up.
“The clarity of [our] base salary is good, but incremental increases year over year are less than modest,” said one retail bank advisor. “It does not keep up with inflation over the longer term.”
For brokerage and dealer advisors, there was less of a gap between their average pay reviews and expectations — and dealer advisors don’t rate their firms for bonus structure due to differences in that space. Many advisors across the two dozen firms assessed in those two channels used the terms “clear,” “competitive” and “fair” to describe their pay grids, though there are always varying opinions.
For example, one brokerage advisor in Ontario said they were generally satisfied with their pay but also noted, “On an annual basis, we do see incremental changes. When you read between the lines, it’s not in our favour.”
A dealer advisor in Ontario discussed how a product wholesaler had criticized the payout advisors with their firm were receiving. “The grid [at my dealer] is not transparent,” this advisor said, suggesting it was hard to tell how much they should be making in relation to their book size. “A wholesaler said I wasn’t getting the right compensation. They told me I can get better compensation elsewhere.”
Wealth planning enhancements
Two other categories listed among the 10 with the greatest satisfaction gaps were “products & support for high-net-worth clients” and “support for tax planning, wills & estates.” They had gaps of 0.8 and 0.6, respectively, between their collective performance and importance averages.
While the high-net-worth (HNW) client was also on this same list in the 2024 summary Report Card, the tax and estate planning category wasn’t.
For the HNW category, the gap was largest in the dealer segment. That channel’s performance had dropped significantly (by half a point or more) to 7.6 from 8.1 a year ago, and some dealer advisors who had wealthy clients asked for greater access to advanced planning experts and resources. This was most prevalent where dealer shops hadn’t built private wealth arms or advanced planning teams.
“There is no service that I am currently aware of to [help us] provide a unique HNW experience,” said one dealer advisor in Ontario. They also requested greater financial, insurance and estate planning support, adding, “We are pretty much on our own. … [We] lean on the asset manager resources.”
For estate planning, the gap was largest in the retail-bank space where the mutual fund advisors and planners are typically less credentialed. Those respondents rated the Big Six 8.2 for performance in the category, while the importance rating was 9.2 (the numbers were 7.8 and 9.0 a year ago, also representing a large gap).
These professionals depend on expert partners within their banks to go in-depth with clients, so performance can depend on the tenure, quality and accessibility of those teams or divisions.
“While [my bank] is trying to focus on wills and estates, and tax planning, … the representative [overseeing this in the branch] is still quite new,” said one retail bank advisor in British Columbia. When the experts change too often and/or get promoted, this advisor said, support is “minimal” and the settling of complex client estates can take a long time.
A separate retail bank advisor who also worked in B.C., but at a different bank, was happy with their financial planning software. But when it came to HNW clients and advanced planning, they said diversification in the products and services offered was “missing.” About estate planning, they added, “There are training [opportunities] but not as many as for marketing. … They could increase the frequency.”
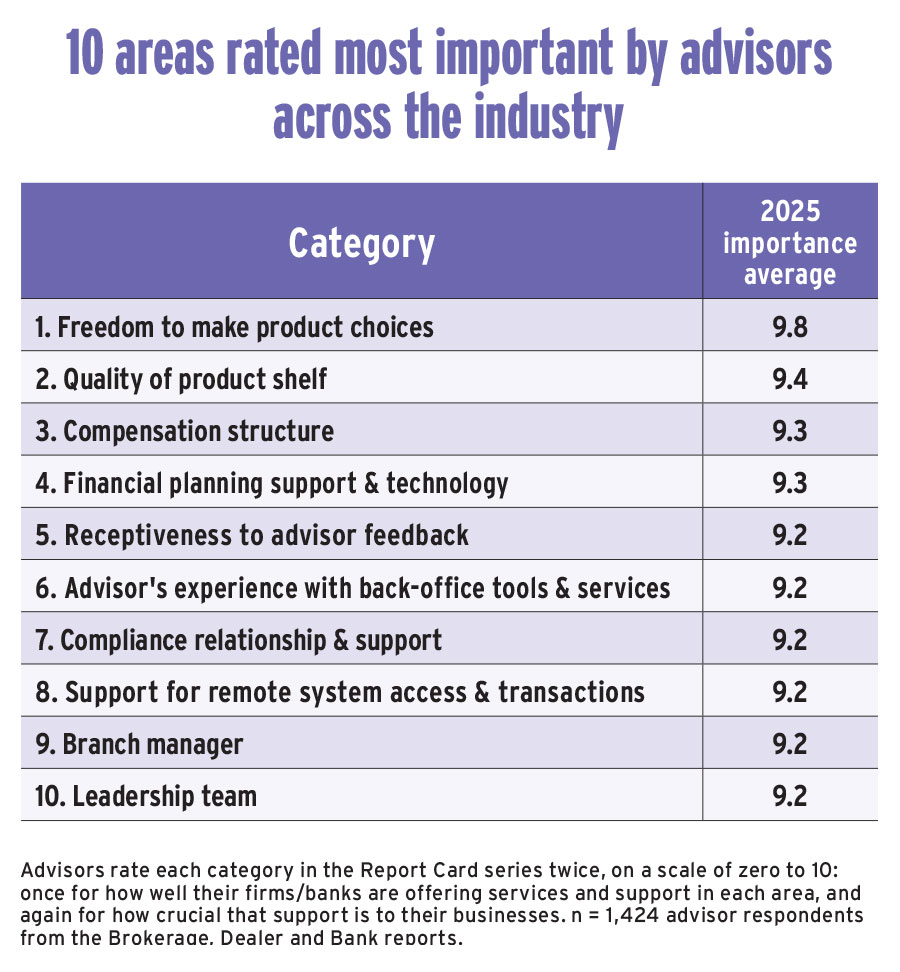
A key part of wealth planning is whether an advisor has ample freedom to choose suitable products for clients. As in past years, that category was again rated most important by brokerage and dealer advisors, at a collective 9.8. It was also rated highest for collective performance this year, at 9.6. This made it one area where firms more successfully met advisors’ expectations. (Retail bank advisors no longer rate this category due to their more limited product shelves.)
Generally, the feedback was positive concerning advisors’ product freedom.
“We truly are able to invest in anything we want for our clients,” said a brokerage advisor in B.C. “There’s no forcing to sell products.”
The other categories with top ratings for collective importance included several related to this overall analysis, such as “quality of product shelf” (rated 9.4), the compensation structure category (9.3), and “financial planning support & technology” (9.3) and “advisor’s experience with back-office tools & services” (9.2).
“There are areas that still need to be improved,” said a brokerage advisor in Alberta. While they were generally satisfied with their pay and firm, they offered guidance similar to that of the average Report Card advisor. “They need to add more bench strength to [the] tax and estate planning team,” this advisor explained, at the same time as improving “operations where obstacles [can be] removed, developing better systems with back office.”
Click image for full-size chart
This article appears in the November 2025 issue of Investment Executive. Read the digital edition or read the articles online.