The dealer business is booming, with financial advisors working within this channel reporting strong growth in assets and increased productivity. But, even in this heady climate, there are signs that financial advisors are preparing for choppier waters ahead.
According to the 2019 Dealers’ Report Card, advisors at Canada’s fund dealers generated impressive growth in assets and boosted their productivity. For the average advisor in our survey, assets under management (AUM) were up by more than 25% compared with last year. Average AUM came in at $48.6 million this year, up from $38.4 million in 2018.
While some of this growth was due to advisors increasing their client bases, much of it was likely attributable to robust market returns. Advisors added client households over the past year, with average client household numbers rising to 208.2 from 197.7 in last year’s survey. But this increase in rosters was well below the growth rate for advisors’ assets.
Along with this increased number of client households, average assets were likely boosted by a combination of market gains and advisors consolidating their clients’ assets from other institutions.
Average advisor productivity (measured as AUM/client household) also ramped up, jumping from just under $240,000 in last year’s survey to more than $320,000 this year.
This dramatic increase in average advisor productivity is somewhat overstated due to a significant outlier in the data: an advisor with AUM/client household of almost $16 million, which was more than double the next-most productive advisor in the survey.
Even excluding this outlier, the increase in average AUM/client household is still impressive – rising by about 20% from last year to almost $290,000.
Again excluding the outlier, average productivity for the top 20% of advisors came in at $805,973. Looking at the full data set, average productivity was substantially higher: slightly less than $970,000.
Click the image below or the documents link to download a PDF of the chart.
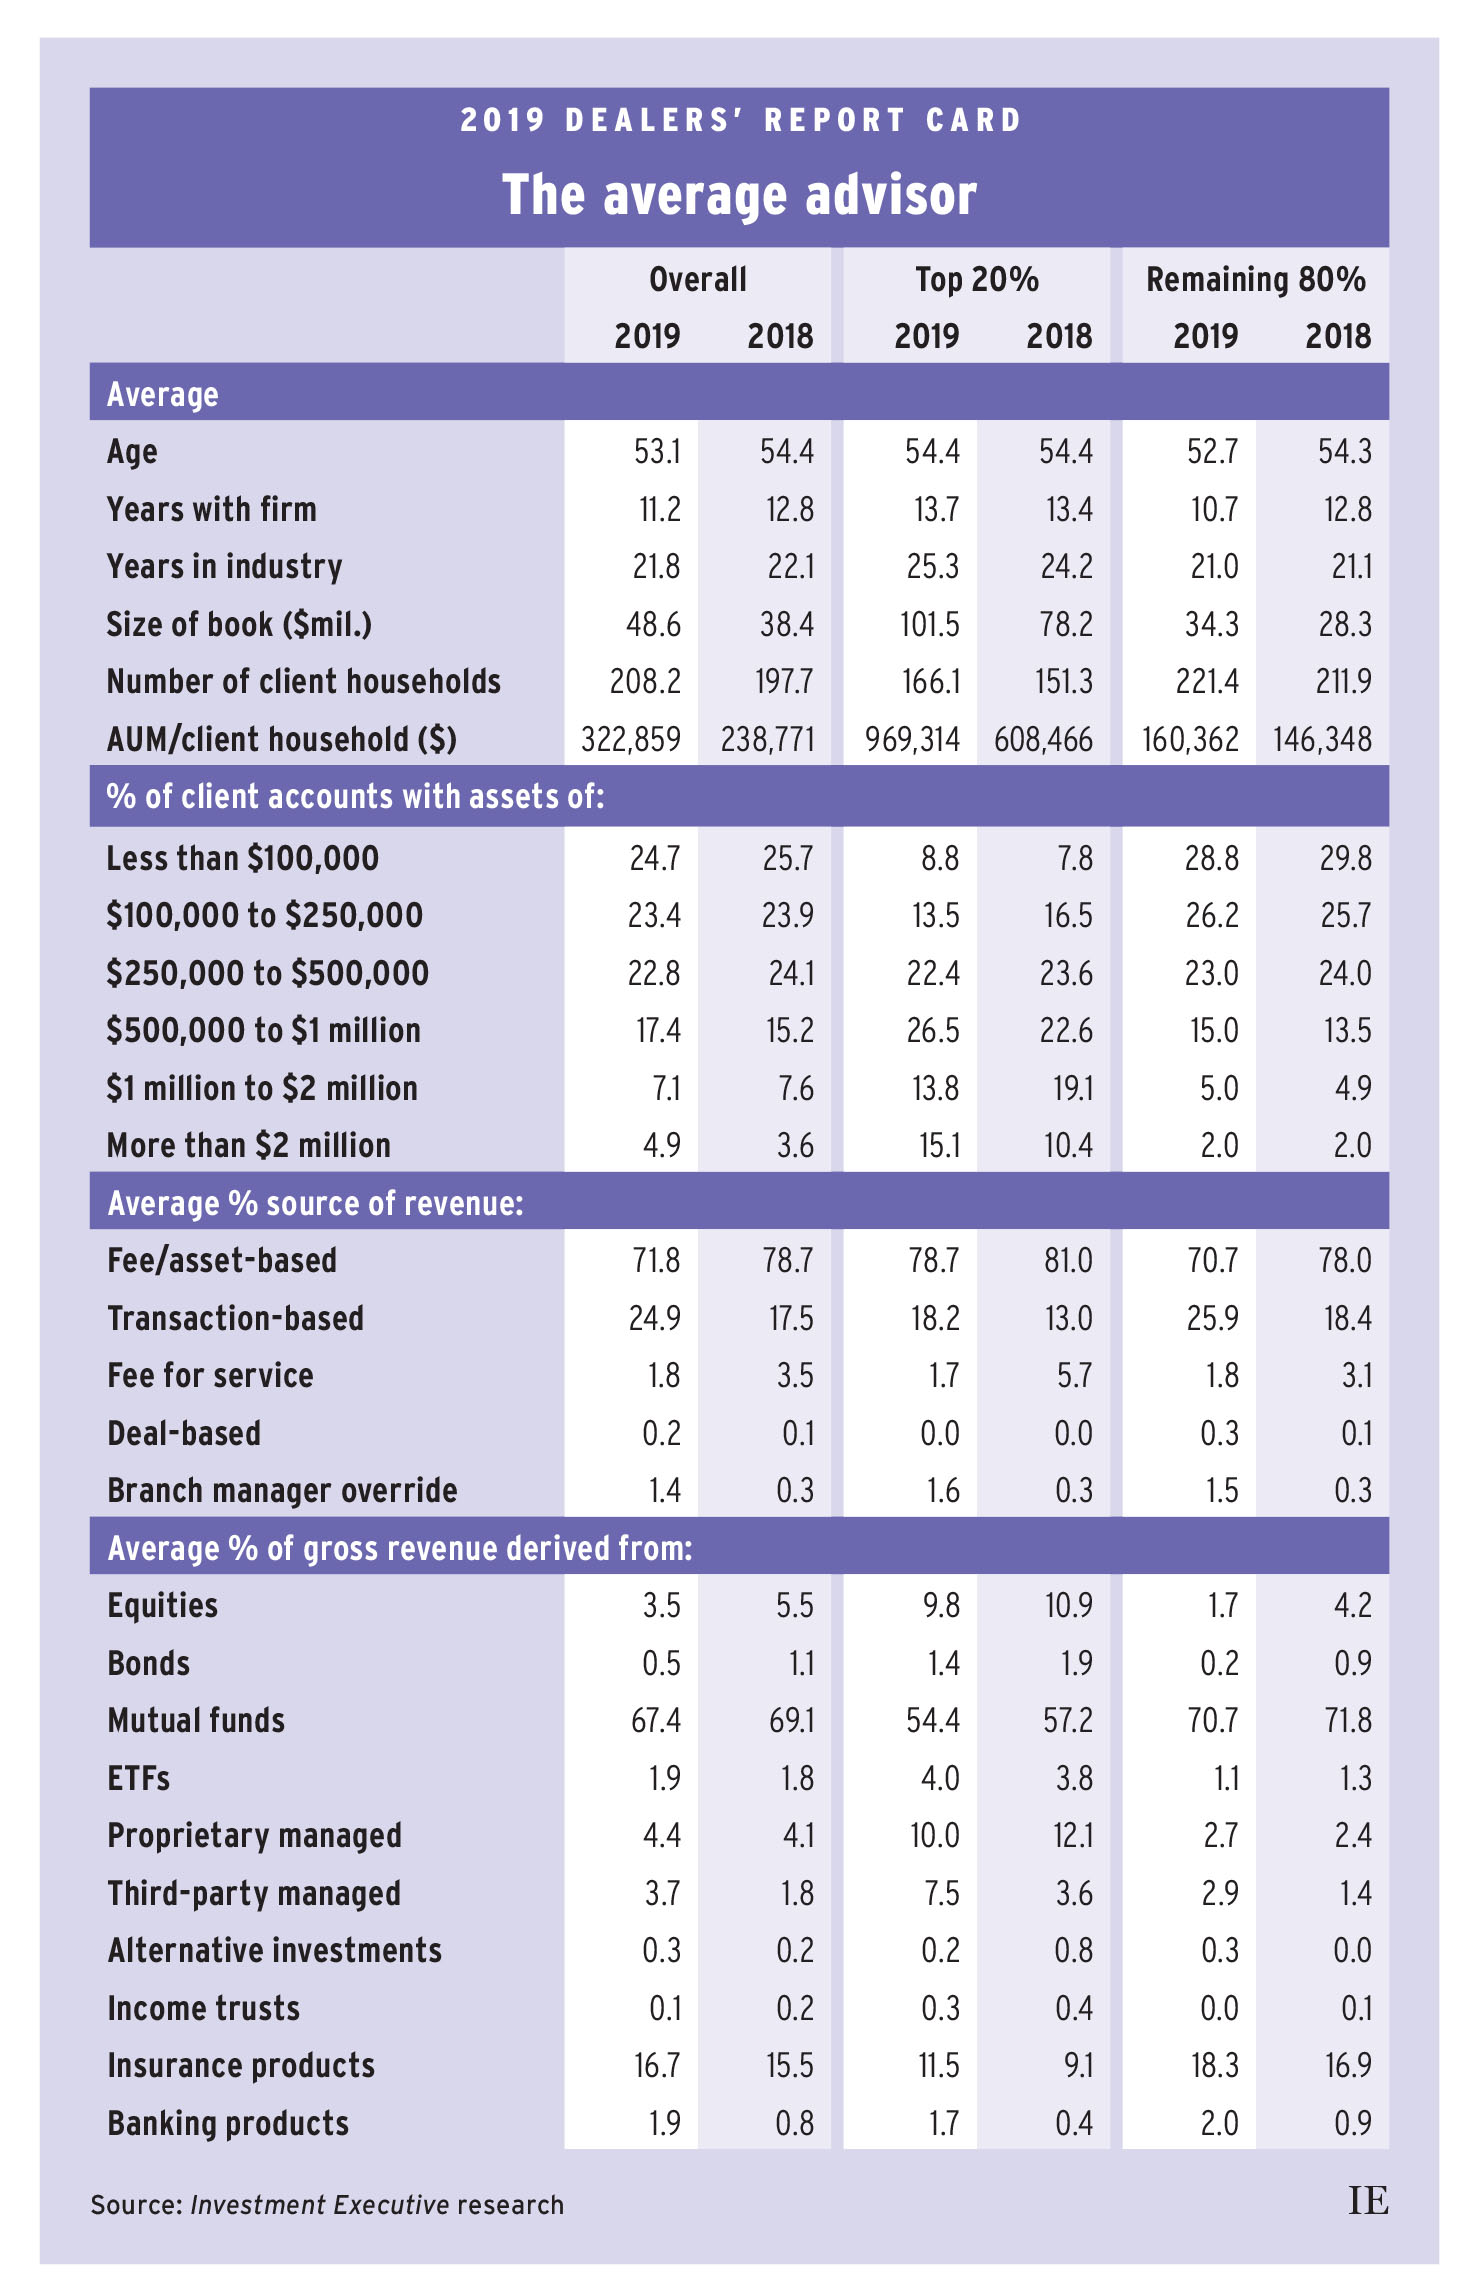
Similarly, for the other 80% of advisors, average AUM/client household rose notably year-over-year. This year, average productivity increased to $160,362, up from $146,348 in 2018.
For both segments of the overall advisor population, these increases in productivity were being driven both by higher asset bases and client household numbers. Asset growth was far ahead of the rise in client household numbers, however, enabling the increase in productivity.
For the top 20%, not only was their average book much bigger than those of the rest of the advisor population – the average top performer’s book was $101.5 million, compared with $34.3 million for the other 80% of advisors – but the growth rate for their books also outpaced the rest of the industry. For the top-producing advisors, average book size was up almost 30% from the previous year, while the average book size for the rest of the industry was up more than 21% from last year.
The industry’s top performers also grew their client bases faster than the rest of the advisor population. While the top 20% of advisors had smaller absolute client-household numbers than the other 80% – typically reflecting a greater focus on high net-worth clients – they added 15 client households, on average, over the past year, taking the average book to 166 client households from 151. The rest of the industry added only nine new client households on average, taking the average book to 221 client households from 212.
The increase in average productivity also was reflected in the account distribution data, which points to advisors increasing the portion of their books devoted to higher net-worth client households. For the overall advisor population, for example, the share of accounts worth less than $500,000 dropped to 70.9% this year from 73.7% in last year’s survey. Conversely, the share for larger accounts increased, including accounts worth more than $2 million: those constituted 4.9% of the average book, up from 3.6% last year.
For top performers, the share of accounts worth less than $500,000 dropped from 47.9% last year to 44.7% in 2019. For these advisors, the increase in higher-value accounts was particularly evident at the top end of the account distribution, with the share for accounts worth at least $2 million jumping to 15.1% from 10.4% in 2018.
The lower 80% of advisors also reported that their share of sub-$500,000 accounts was declining, albeit from a much higher level, dipping to 78.0% from 79.5%. The largest accounts weren’t driving the shift in share for these advisors; rather, the accounts in the $500,000 to $1-million range were responsible for the gain in share of accounts above the $500,000 mark.
Alongside the shifts in account distribution trends, the asset mix for advisors also appeared to fluctuate. Overall, advisors reported making more use of banking and insurance products, while the share of their books in traditional securities (stocks, bonds and mutual funds) declined somewhat.
Mutual funds remained the dominant product category for advisors in the Report Card, but their share was 67.4% this year, down from 69.1% last year. Yet advisors didn’t turn to ETFs, which remained below 2%. Instead, advisors’ reported use of insurance products was 16.7% of the average book this year, up from 15.5% in last year’s survey. (See Need for insurance support growing.) Similarly, their use of banking products more than doubled to 1.9%, from 0.8% in 2018.
Advisors’ reported use of third-party managed products also jumped, rising to 3.7% of the average book from 1.8% in last year’s survey. At the same time, advisors’ allocations to proprietary managed products changed only slightly, ticking up to 4.4% from 4.1% in last year’s survey.
These basic trends are evident among both sets of advisors, who reported declines in their basic holdings of securities, increases in their use of banking and insurance products and a two-fold increase in the share of third-party managed products.
One key difference is an apparent decrease in the use of proprietary managed products for the industry’s top performers. While the top 20% of advisors still made greater use of these products than the rest of the industry, their allocations dipped notably year-over-year. This year, top performers had 10.0% of their books in proprietary managed products, down from 12.1% in 2018. (See The weight of proprietary product.)
The rest of the industry had a much lower allocation to proprietary products, at just 2.7%. But unlike the trend for the industry’s top performers, this actually represents a modest increase, up from 2.4% in 2018.
The increased use of banking and insurance products indicates that advisors may be looking to further diversify their revenue. At the same time, the increase could reflect a desire to take risk off the table for clients, with equity markets at historically high levels and market volatility on the rise in recent years. Both explanations point to growing caution about the market’s prospects after a year of strong growth.
Whatever the motivation for the changes in asset mix, this year’s survey also reveals a notable shift in revenue sources for advisors, which may also be tied to trends in particular products. While fee- and/or asset-based compensation remained dominant revenue sources, the reported share of each was down to 71.8% this year, from 78.7% last year. Conversely, advisors’ reported reliance on transaction-based compensation was up notably, jumping to 24.9% from 17.5% in our 2018 survey.
These trends are evident in the overall advisor population, but the industry’s top performers remain more reliant on fee- and asset-based revenue sources than their counterparts. For top producers, 78.7% of revenue still came from fee- and asset-based sources, down from 81.0% a year ago. The rest of the industry was also down in fee- and asset-based sources, at 70.7%, from 78.0% last year.
The lower 80% of advisors led the increasing reliance on transactions, with transaction-based revenue now generating 25.9% of these advisors’ revenue, up from 18.4% last year. Transactions also were increasingly important for top producers – their share of transaction-based revenue rose to 18.2% from 13.0% last year – but remained less significant for top producers than for the rest of the industry.
Overall, the trends in this year’s survey were largely shared by the dealers’ top producers and the rest of the industry – a case of a rising tide lifting all boats.