This article appears in the June 2022 issue of Investment Executive. Subscribe to the print edition, read the digital edition or read the articles online.
The average dealer advisor is changing as the industry prepares for the consolidation of self-regulatory organizations (SROs) to shrink the historic gap between fund dealers and investment dealers.
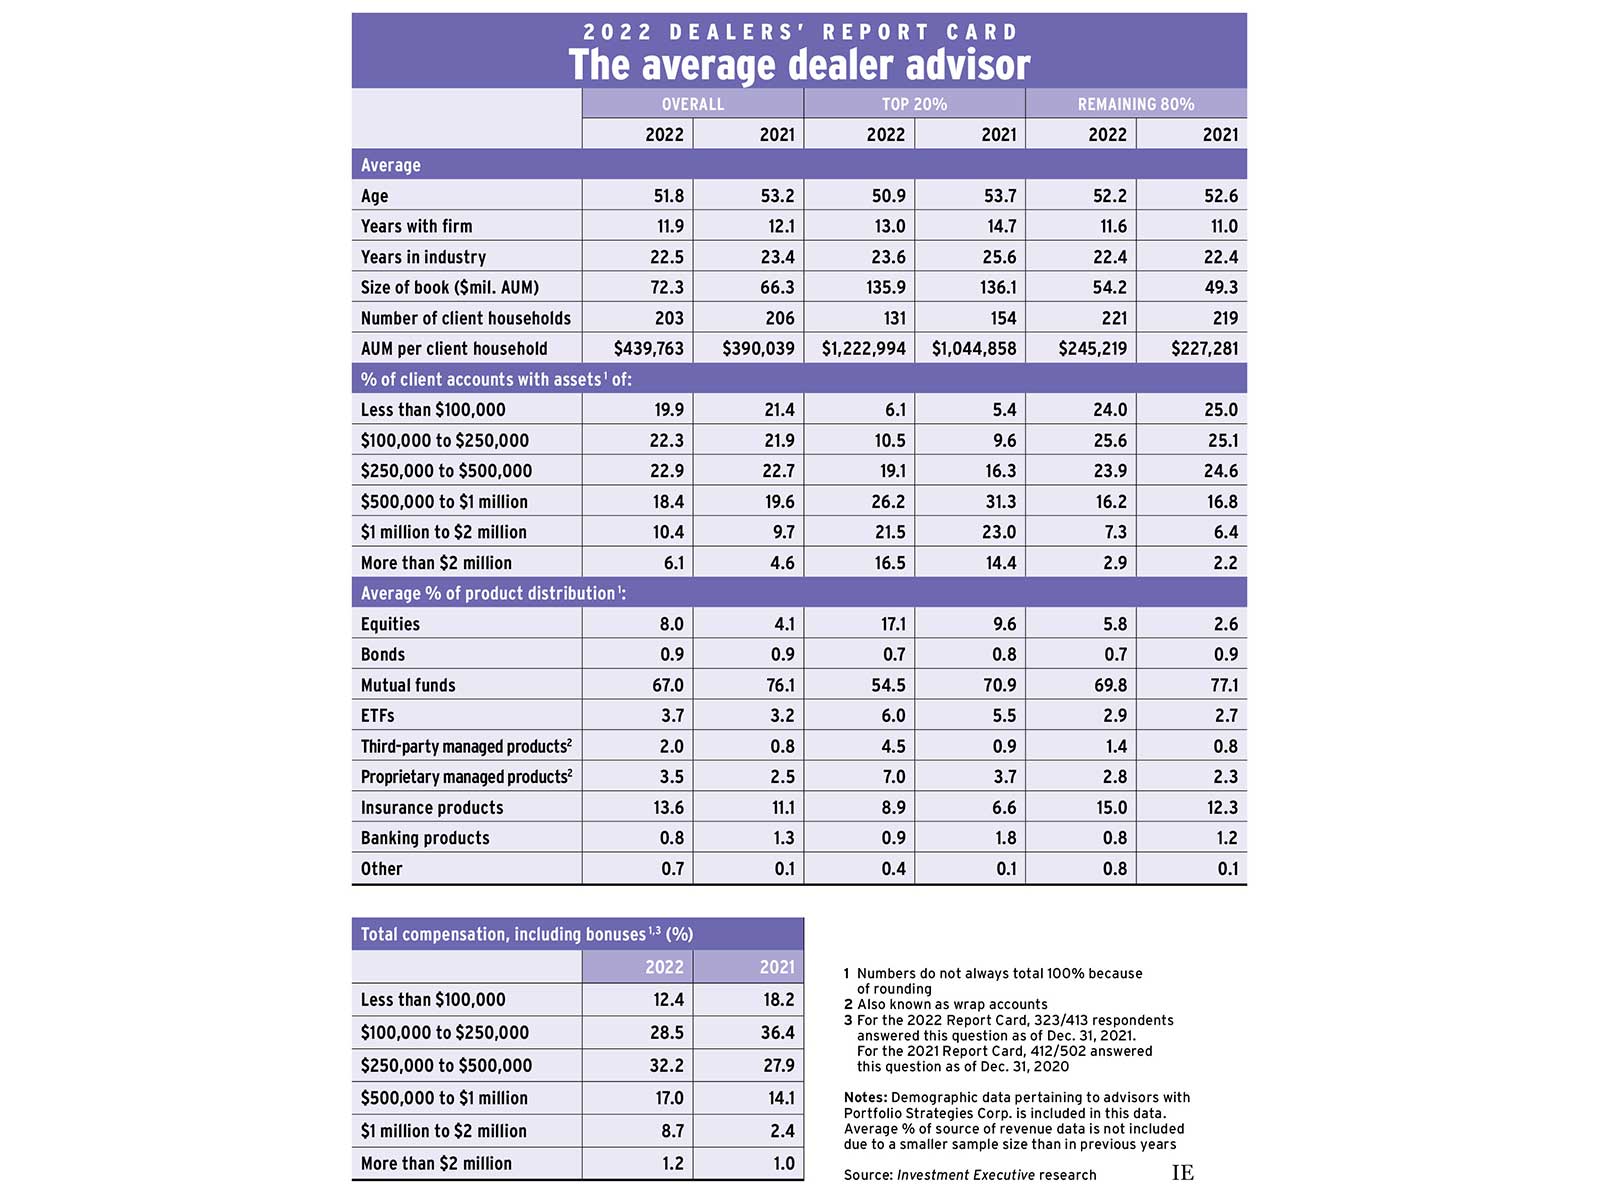
According to Investment Executive’s 2022 Dealers’ Report Card, dealer advisors’ demographics are shifting, clients’ portfolios are diversifying and books are growing.
Average book size (as measured by assets under management as of Dec. 31, 2021) for the advisors in our Report Card rose by about 9% to $72.3 million from $66.3 million as of Dec. 31, 2020. Over the same period, however, major North American and European indexes made double-digit gains.
Productivity (measured as AUM per client household) also improved to $439,763 from $390,039 in last year’s Report Card, as the number of clients served by the average advisor edged lower (from 206 households in 2021 to 203 this year).
The reasons behind this productivity increase were, for the industry’s top performers (defined as the top 20% of advisors in terms of AUM per client household), different from the rest of the industry (the other 80% of advisors).
The top performers gained productivity entirely by cutting client households. The average top performer in the 2022 Report Card served only 131 households, down from 154 in 2021. As a result, average productivity rose to $1.2 million from just over $1 million, even as average book value was about $136 million in both the 2021 and 2022 Report Cards.
The rest of the industry took a different route to increasing productivity: they recorded a noticeable increase in AUM, with average book value rising to $54.2 million at the end of 2021 from $49.3 million at the end of 2020. Client numbers stayed relatively flat over the same period.
Notably, the top-performing advisors were younger than they were in last year’s Report Card: under 51 in 2022 versus almost 54 in 2021. This could reflect a rise in retirements among some of the industry’s older top performers or an influx of younger high-producing advisors (or a combination of both).
The average age for the rest of the industry also ticked down, to 52.2 this year from 52.6 last year. The bigger age drop among the industry’s top performers means their average age is now lower than the average for the rest of the industry.
The top-performing reps in this year’s Report Card also had shorter industry tenures than their peers (down to an average of 23.6 years in 2022 from 25.6 years in 2021) and had spent less time with their current firms (13 years on average, compared with 14.7 years in the 2021 Report Card). Yet the average top-performing rep still had more service time with both their current firm and in the industry overall than the other 80% of advisors did, on average.
Account distribution trends also changed. For the industry’s top performers, the share of their book represented by both the very largest accounts (those worth at least $2 million) and smaller accounts (less than $500,000) increased this year. At the high end, the allocation to accounts larger than $2 million rose to 16.5% this year from 14.4% last year — indicating that these advisors either added very high-end clients or grew existing AUM beyond the $2-million threshold.
Yet, the share of top performers’ accounts worth less than $500,000 also increased to 35.7% from 31.3% a year ago. This higher proportion of lower-value accounts among the industry’s top performers may reflect the lower average age and industry tenure of the advisors in this cohort, as compared with the 2021 Report Card.
For the other 80% of advisors, the vast majority (73.5%) of their accounts still fell into categories under the $500,000 mark. However, these reps also made headway at the top end of account distribution, with their share of accounts worth more than $1 million rising to 10.2% this year from 8.6% in last year’s Report Card.
There also were notable shifts in product allocation. Mutual funds remained the top product, representing 67.0% of the average book, but were down substantially from 76.1% last year.
At the same time, allocations to other categories rose. In particular, allocations to equities jumped to 8.0% this year from 4.1% last year. ETF allocations also edged higher, as did shares for managed products (wrap accounts; both proprietary and third-party). And, the share of the average book devoted to insurance products climbed to 13.6% this year from 11.1% last year.
This increased product diversification comes as the industry faces some major shifts on the regulatory front. A long-standing fund fee structure (deferred sales charges or DSCs) was eliminated on June 1. That development has led to speculation that some advisors will move to segregated funds, which can still use DSCs for an extra year.
In addition, the bright line between investment dealers and fund dealers will soon blur. The planned single SRO will aim to dismantle some traditional regulatory barriers between the two sectors — making it easier for fund reps to sell products other than mutual funds, and for dual-platform dealers to operate more efficiently.
Click image for full-size chart