This article appears in the May 2021 issue of Investment Executive. Subscribe to the print edition, read the digital edition or read the articles online.
Despite a year spent in the grips of the pandemic, the average brokerage advisor weathered the storm remarkably well.
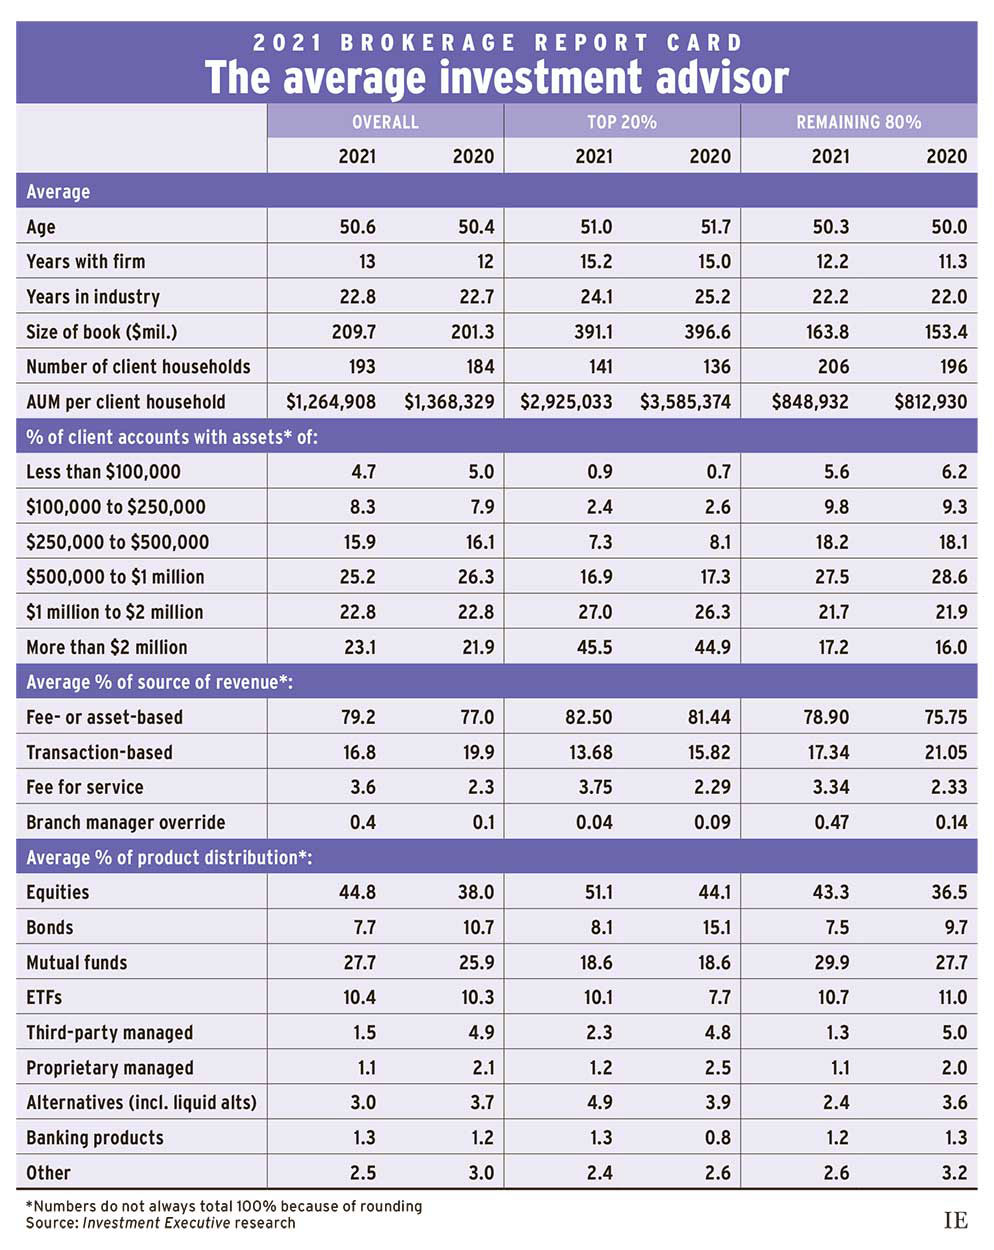
Overall, average assets under management (AUM) were up by about 4.2% from last year, climbing to $209.7 million from $201.3 million in 2020, according to data from Investment Executive’s 2021 Brokerage Report Card.
Despite a brief rocky period for financial markets last year, most major equities benchmarks ended the year higher. For the year ended Dec. 31, 2020, the S&P/TSX composite index was up 2.17%, while the S&P 500 and the Nasdaq composite were up 16.3% and 43.6%, respectively. (Respondents gave their AUM and revenue figures as of Dec. 31.)
Rising markets were accompanied by an increase in savings: according to the Bank of Canada, household savings have surged over the past year, particularly among higher-income groups.
Along with higher AUM, the advisors in our survey reported increased client numbers this year. The average client household roster edged up to 193 from 184 last year. However, advisor productivity (as measured by AUM/client household) dipped to $1.26 million from $1.37 million last year as a result of a modest increase in AUM being spread over a larger client base.
Often, the top-performing brokerage advisors — defined as the top 20% in terms of AUM/client household — drive the industry’s growth. But that was not the case this year. Productivity was down for the top 20% of brokers, while the remaining 80% saw an increase.
Among the industry’s top performers, average assets slipped to $391.1 million this year from $396.6 million in 2020, while the average number of client households edged up to 141 from 136. This pushed average productivity for the top performers down to $2.9 million this year from $3.6 million last year.
Some of this shift may reflect differences in this year’s survey sample, which was slightly younger and less experienced. The average age of the top performers in this year’s research was 51, down from 51.7 in last year’s survey. The average top performer reported being in the business for just over 24 years, compared with last year’s average of over 25 years.
The effects of the pandemic also may have squeezed the assets of top producers. Small business owners may have dipped into their holdings to keep a company afloat. Given the surge in housing demand, clients may have drawn on their assets to finance costly real estate purchases or renovations.
Despite the pandemic, the advisors who made up the other 80% of our survey respondents still saw growth in assets and client numbers. Average AUM rose to $163.8 million this year from $153.4 million last year, and the average number of client households ticked up to 206 this year from 196 in 2020. With asset totals rising more quickly than household numbers, productivity for these advisors rose to just under $849,000 in this year’s survey from almost $813,000 in 2020.
There also have been significant changes to asset allocation. Across all advisors, equities exposure jumped to 44.8% of the average book from 38.0% in 2020, and mutual fund allocations climbed to 27.7% from 25.9%. Meanwhile, bond holdings dropped to 7.7% from 10.7% in 2020.
These changes may have reflected market action — equities allocations may have risen as stock markets hit new heights, and advisors could have adjusted to ultra-low interest rates and scarce yields.
Among top performers, equities allocations rose substantially, representing 51.1% of their books and up from 44.1% last year. Among the other 80% of advisors, equities allocations rose to 43.3% this year, up from 36.5% in 2020.
Bond allocations dropped on both sides of the industry — particularly for the top performers, who reported their average share of bonds plunged to just 8.1% this year from 15.1% last year. For the other 80%, bond allocations dropped to 7.5% from 9.7% last year.
Mutual funds gained share among the other 80% of advisors, rising to 29.9% this year from 27.7% in 2020. For top performers, mutual fund allocations were flat year over year at 18.6%, while ETF allocations rose to 10.1% from 7.7% in 2020.
ETFs have taken over as the third-largest holding among advisors overall at 10.4% of the average book. Bonds dropped to fourth spot with a 7.7% share.
Another notable change was a reported plunge in managed products (both proprietary and third-party), which dropped to 2.6% of the average book last year from 7.0% in 2020. Allocations to third-party managed products dropped to 1.5% this year from just under 5% last year. The share for proprietary products also nearly halved, slipping to 1.1% from 2.1%. Similar declines occurred among the top 20% of advisors, as well as the rest of the industry.
Alongside these shifts in asset allocation, both segments of the industry reported increased exposure to the highest-value accounts.
Among the industry’s top producers, the share of the average book that’s allocated to accounts worth over $2 million rose to 45.5% this year from 44.9% in last year’s survey. For these advisors, allocations to accounts in the $1 million–$2 million range also increased year over year, while allocations to almost every other category either declined or were essentially unchanged. Accounts worth more than $1 million now make up 72.5% of top performers’ books, up from 71.2% last year.
For the other 80% of advisors, the biggest increase also went to accounts worth over $2 million, which accounted for 17.2% of the average book this year, up from 16.0% last year. Accounts in the $500,000–$1 million range for this segment dropped to 27.5% this year from 28.6% last year. The share allocated to accounts under $100,000 also declined, and the share in the $100,000–$250,000 range ticked up.
Notwithstanding the ongoing drift toward larger accounts and increased exposure to equities, the bottom-line results for advisors were a mixed bag.
The proportion of advisors who reported earning over $2 million jumped to 7.9% this year from 5.3% last year. The proportion of advisors earning $500,000–$2 million declined from last year. Some likely drifted up to the top compensation tier, while others likely dipped into the $250,000–$500,000 range. That was the only other compensation category that saw an increase this year, rising to 28.6% of the overall rep population from 27.1% in 2020.
On balance, the brokerage sector appears to have weathered the pandemic relatively well. While the past year was tumultuous, the average advisor appears to be thriving nonetheless.
Click image for full-size chart