The past 12 months have been favourable for Canadian brokerages, with advisors enjoying growth in their books and a boost in compensation to match. How long will the good times last?
The latest edition of the Brokerage Report Card reveals a thriving industry. The average advisor in this year’s survey enjoyed impressive growth, with both assets under management (AUM) and client household numbers on the rise. With asset gains outpacing client growth, advisor productivity (as measured by AUM per client household) was also up from last year.
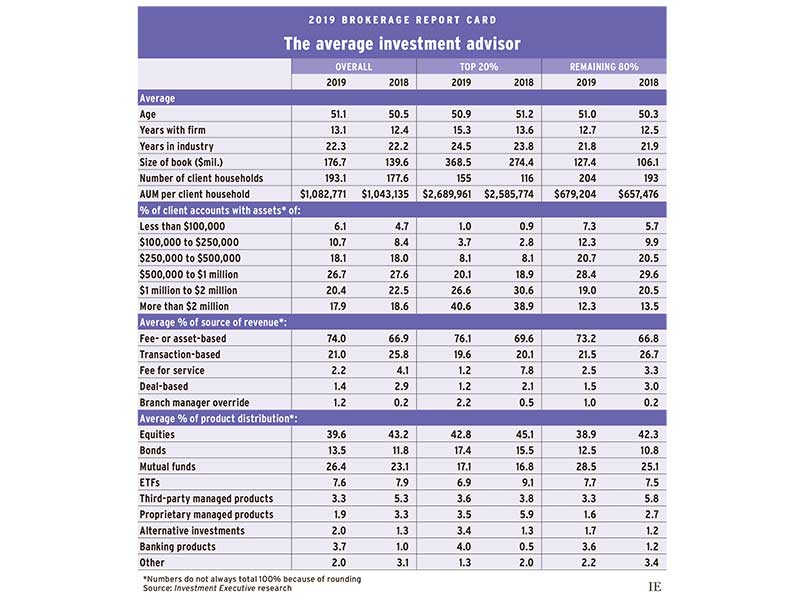
The average advisor reported $176.7 million in AUM, which was up by 26.6% from last year’s $139.6 million. This large increase in average AUM represents accelerating growth from 2018. Last year, the average rep’s book also expanded, but the year-over-year increase was a more modest 7.6%.
Click the image below to download the chart.
To some extent, the boost in average AUM can be attributed to growth in average client rosters. Over the last year, the average rep reported 193.1 client households on the books, up from 177.6 in the 2018 Report Card.
The increase represents a reversal from the previous year, when client rosters ticked down a bit. It also runs contrary to the headline trend in recent years of advisors trimming their books to focus on higher-value households.
The growth in advisors’ books also came against the backdrop of strong market gains over the past year. While volatility ramped up in the fourth quarter of 2018, global markets had a solid year overall.
For the year ended March 31, 2019, the S&P/TSX composite index gained 9.2%, while the S&P 500 gained 12%. Despite negative returns for Japan and emerging markets, world markets were up 8.2% overall for the period.
These gains enabled average AUM per household to rise even as the number of client households served grew. This year, average rep productivity edged up from $1.04 million in last year’s Report Card to $1.08 million this year.
These headline trends were evident for both the industry’s top producers (defined as the top 20% of reps based on AUM per client household) and the rest of the advisor population – although top producers saw stronger gains than the rest of the industry.
While the average advisor reported robust increases in client assets, this year’s top producers enjoyed even faster AUM growth. The top 20% of reps boasted average AUM of $368.5 million, up from $274.4 million in last year’s survey. This represents a year-over-year increase of 34.3% for the industry’s top performers.
By contrast, the other 80% of reps reported that their average AUM grew by about 20.1% from the previous year. Growth was still impressive, rising from an average $106.1 million in 2018 to $127.4 million this year.
These disparate growth rates point to an industry skewing heavily in favour of its top producers. In the 2018 Report Card, the average AUM for the top 20% of reps was already more than double the average for the rest of the industry ($274.4 million compared with $106.1 million). This year, the industry’s top performers built on their already large lead, with average AUM for the top 20% of advisors almost triple the average for the rest of the industry.
The top performers’ large edge in asset growth appears to be powered by a much bigger increase in client numbers. For instance, while average client numbers inched higher for the other 80% of reps, rising from 193 in last year’s survey to 204 this year, the average client numbers for the industry’s top producers jumped from 116 in 2018 to 155 this year.
Despite this relatively large increase, top producers still saw their productivity increase year-over-year, as asset gains outpaced growth in client rosters. Average AUM per client household for the top 20% of reps rose from just under $2.6 million in last year’s survey to almost $2.7 million this year.
Productivity also increased for the other 80% of reps, with average AUM per client household in this segment rising from $657,476 in last year’s survey to $679,204 this year.
These headline trends in assets, households and productivity are also reflected in the composition of advisors’ books. The account data for the remaining 80% of advisors, for example, point to an increase in the proportion of smaller accounts within their overall books: those advisors reported an increase in share for every account category below the $500,000 mark.
This year, accounts worth less than $500,000 made up 40.3% of the average book for 80% of reps, which is up from 36.1% in last year’s Report Card. These data seem to indicate that their new clients are coming in on the low end of the account distribution.
For the industry’s top performers, accounts larger than $2 million were up from 38.9% of their book last year to 40.6% this year.
At the same time, these advisors reported that the share of accounts worth between $1 million and $2 million was down somewhat from last year, and the proportion of their book made up of accounts under $1 million had increased a bit.
Looking beyond client account distribution data, the 2019 Report Card indicated the brokerage industry’s long-running shift away from transactions toward fees is continuing unabated. Reps reported that just 21.0% of their revenues were generated by transactions, down from 25.8% a year ago. Conversely, fee- and asset-based sources represented 74.0% of the average advisor’s revenues.
These same trends were evident among both the top 20% of advisors and the rest of the industry; the top performers derived more than three quarters of their revenues (76.1%) from fees and asset-based sources, up from 69.6% a year ago. The rest of the industry trended in the same direction, with 73.2% of their revenues being fee or asset-based, up from 66.8% last year.
Not surprisingly, the strong growth in advisors’ businesses flowed through to their bottom lines: more than a fifth (20.8%) of Report Card respondents reported making over $1 million in annual compensation, up from 13.2% in last year’s survey.
Only 18.9% said they were earning less than $250,000 per year, down from 25% in last year’s survey. Only 2.4% said they make less than $100,000 per year (down from 3.8% in 2018).
So, while top performers outpaced the rest of the industry in terms of client, asset and productivity growth, it appears the spoils of a very strong year for the brokerage business were shared throughout the advisor population.
Veterans of the retail investment business know that the good times never last forever, and responses indicated that advisors may be preparing for tougher days ahead. Looking at the asset allocation data from this year’s research, it appears advisors took a bit of investment risk off the table.
Reps’ allocations to equities were down from 43.2% last year to 39.6% this year; bond allocations were up from 11.8% in 2018 to 13.5% this year. These trends were consistent among both top performers and the rest of the industry.
Bigger differences within the advisor population were evident in some of the lesser asset classes. Top producers, for instance, said that their use of alternative investments was up to 3.4% of their book from just 1.3% a year ago. The rest of the industry made greater use of mutual funds, which comprised 28.5% of the average book – up from 25.1% a year ago. At the same time, allocations to managed products (both in-house products and third-party products) were down across the industry.
Whether reps are right to be preparing for tougher times remains to be seen – there’s no question that the past year has been outstanding for them, so it may well prove wise to guard against a change in fortunes.