This article appears in the Mid-October issue of Investment Executive. Subscribe to the print edition, read the digital edition or read the articles online.
The average financial advisor managed to scrape together a bit of growth despite sharply shifting economic and financial conditions, according to Investment Executive’s (IE) 2023 Advisors’ Report Card. But the gains weren’t distributed evenly across the industry.
While the brokerage and dealer channels posted higher average assets under management (AUM), branch-based retail bank advisors with the Big Six banks experienced downward pressure.
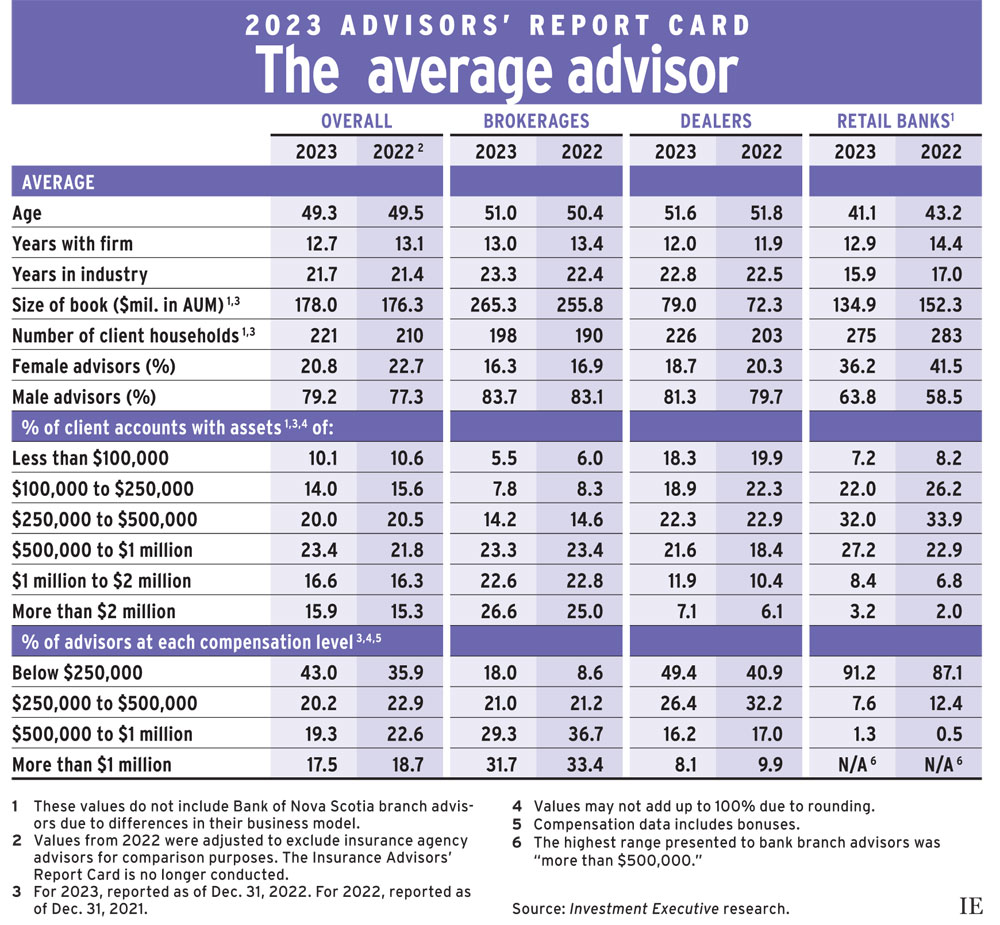
The Advisors’ Report Card, which analyzes the data collected for this year’s Brokerage Report Card, Dealers’ Report Card and Report Card on Banks (see How we did it), revealed the average advisor across all three channels reported AUM of $178.0 million as of Dec. 31, 2022. That’s up slightly from $176.3 million the year prior.
Given market conditions, that $2-million year-over-year increase represents an achievement. The S&P/TSX composite index closed 2022 down by almost 9% (the period relevant to Report Card AUM data). In the U.S., the S&P 500 lost more than 19% over the same period, while the Nasdaq lost 33.1%.
Amid these conditions, AUM for the average dealer advisor rose by 9.3% to $79.0 million in this year’s research from $72.3 million in the 2022 Report Card. The average brokerage advisor saw AUM increase by 3.7% over the same period, while the average retail bank advisor saw AUM fall by 11.4%.
This shift was echoed in the average number of client households served by each group. The brokerage and dealer channels both saw year-over-year increases in that figure, with household growth outpacing AUM growth in both channels.
In contrast, the average retail bank advisor reported serving fewer households in this year’s research compared with last year’s (275, down from 283). Average AUM dropped more rapidly than average client numbers for this channel.
A slight shift toward households with higher assets was apparent across all channels, with middle-class client accounts gaining the most share on average.
Client accounts with assets between $500,000 and $1 million represented 23.4% of the overall average advisor’s book this year, up from 21.8% a year ago. Meanwhile, the share of accounts with assets of $500,000 or less dropped to 44.1% from 46.7%.
But the share of client accounts with assets of $1 million or more changed little for the average advisor: 32.5% in the 2023 Report Card versus 31.6% a year ago.
Even though the average advisor grew their AUM and household figures, their compensation (also reported as of Dec. 31 in 2022 and 2021) fell year over year. The share of advisors who made up to $250,000 per year, including bonuses, increased to 43.0% from 35.9%, but the share of advisors in the higher compensation categories dropped over the same period.
This downward pressure was evident across all three channels. The shift was most striking in the brokerage space, where the share of advisors in the lowest-paid category grew to 18.0% in the 2023 Report Card, up from 8.6% the year prior.
Click image for full-size chart