Surging equities markets are powering advisors’ books of businesses to fresh heights, but shifting dynamics within the brokerage industry itself may be weighing on their bottom lines.
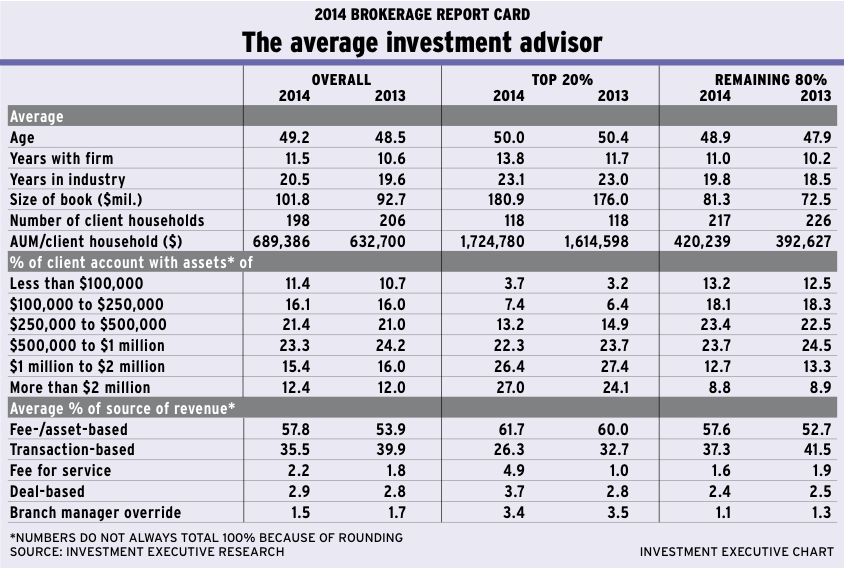
The latest edition of Investment Executive’s (IE) Brokerage Report Card reveals that the average advisor is enjoying strong growth in assets under management (AUM). The average advisor’s book of business now tops $100 million in AUM for the first time ever – having risen by almost 10% to $101.8 million from $92.7 million the previous year.
And productivity is up by a similar rate, given that the size of client rosters changed little from the previous year. (The average broker now serves 198 client households compared with 206 client households in 2013.) Combined, these trends mean average AUM/client household is up to $689,386 this year, which represents growth of about 9% from 2013.
These headline results are not hard to fathom. Equities markets have remained buoyant over the past year, which automatically stokes AUM. And with little change in overall client rosters, the rise in AUM naturally leads to higher productivity.
Yet, beneath the headline gains, there are some signs of nervousness in this year’s data. For one thing, advisors seem to be staying put with their firms. Despite anecdotal reports of a healthy recruiting market, IE’s survey found that the average broker reported being with his or her firm for 11.5 years, about a year longer than in 2013. This suggests that most advisors aren’t shifting seats.
Similarly, average tenure in the industry itself is up by about a year, to 20.5 years, and the average age of the advisors in the Report Card also is up – to 49.2 years from 48.5 in last year’s survey. These demographic data suggest that the overall advisory population is quite stable relative to the previous year and that there isn’t a lot of movement in or out of the business – or among firms within the industry.
One reason for this apparent stagnation may be an entirely reasonable concern about the sustainability of recent results. The continued rise in equities markets over the past year is already defying fears about market and economic fundamentals.
For example, there’s the prospect of higher interest rates. Moreover, certain technology companies’ valuations appear to be venturing to very elevated levels, stoking fears among some market-watchers that the tech sector has entered bubble territory yet again and may be ripe for a plunge.
In addition, domestic worries persist amid record household-debt levels and possibly overheated housing markets. And, with emerging markets facing weaker economic growth, there are concerns about the future path of commodities prices. At the same time, in the low interest rate environment and the fact that rates will rise at some point, fixed- income returns appear imperilled.
Given all of these trends, market realities and fears for the future, it’s no surprise that many advisors may be simply content to stay the course for now.
Yet, at the same time, the investment industry may be undergoing some transition of its own as veteran brokers face retirement. For these advisors, getting out while markets are strong may seem like a good play – particularly when the future looks dimmer.
Indeed, drilling a little deeper into the Report Card data, it’s apparent that almost all of the industry’s recent growth is coming from younger, smaller producers. The books of the so-called “top producers” essentially are stagnant, and there appears to be some changes in the composition of that segment of the industry.
IE divides the advisor population into the top 20% and the remaining 80%, based on AUM/client household. On that basis, the data in this year’s survey show that it’s the remaining 80% of advisors who are powering overall average AUM growth. Although the top producers still have more than double the AUM of the remaining 80%, the totals for the former group are growing at a much slower rate. Among the top 20% of brokers, average AUM is up by only 2.8% over the past year, to $180.9 million from $176 million. In comparison, the average broker among the remaining 80% is reporting average AUM of $81.3 million, up by 12.1% from $72.5 million year-over-year.
In both segments of the industry’s advisor population, the number of client households being served is relatively unchanged, while the average broker’s productivity is up solidly from the previous year. For the top 20% of advisors, AUM/client household is now more than $1.7 million vs $1.6 million in 2013; for the remaining 80% of advisors, that figure now is $420,239 vs $392,627 last year.
Looking at the demographics of both advisor segments, it appears that the top producers may be undergoing some transitions. For example, the average age of the top 20% is down slightly this year, to 50 years of age from 50.4 years in 2013, but industry experience is unchanged at about 23 years. This suggests that some proportion of the older top performers have left the business over the past year.
Presumably, the AUM these retired advisors had controlled have been redistributed among younger, less established advisors – helping to fuel that segment’s above-average AUM growth – rather than to other top producers.
Indeed, the demographics of the remaining 80% of advisors suggest a normal progression for that population, with the average age, industry experience and tenure with their current firm all increasing by about a year vs 2013. This trend suggests that this segment of advisors is just another year older and more experienced – and seemingly benefiting from both some turnover among the top producers and the robust markets.
Evidence for this transition also is apparent in the compensation data, which show a decrease in the proportion of brokers making big money. Although there’s still 2% of the industry’s advisors who reported earning more than $2 million a year (unchanged from 2013), advisors who reported annual compensation of between $500,000 and $2 million is down year-over-year. Last year, slightly more than one-third of brokers reported making $500,000 or more annually; this year, that percentage is down to 28.7%. Conversely, every category below the $500,000 threshold is up year-over-year. (See page C7 for more information.)
This shift may reflect changes to compensation grids and ever-increasing technology and regulatory costs, but also may be due to changes in industry composition as older top performers retire.
An industry in transition
There also are interesting indications in the account distribution data that the industry is in transition. Looking at the overall average broker population, the most significant changes in distribution are coming at opposite ends of the spectrum. At the top end, the proportion of accounts worth more than $2 million was up to 12.4% from 12% last year, while the sub-$100,000 accounts in the average book rose to 11.4% this year from 10.7% last year.
This shift at the higher end of the account AUM spectrum came entirely from the top 20% of advisors, who reported that 27% of their accounts now fall into the $2 million or more category vs 24.1% last year, making this category the single-biggest account AUM category in the average book among these brokers. Among the remaining 80%, the share of their books in the biggest accounts is essentially unchanged from last year.
Overall, the average share allocated to accounts in the $500,000-$2 million range is down from 2013, but there has been an increase in share for each category below the $500,000 threshold.
In fact, both top producers and the remainder of advisors in the industry are seeing higher shares of book devoted to their smallest accounts. For the top 20%, this probably reflects the apparent handoff taking place, with older advisors leaving and younger, less established advisors (with less mature books) beginning to appear among that segment of the population. In contrast, the growth in small accounts for the remaining 80% of advisors probably is due more to new client acquisition.
For both segments of the broker population, the industry’s ongoing shift to fee- and asset-based revenue sources vs transaction-driven revenue continues. Overall, just 35.5% of gross revenue now come from transactions, with fees and asset-based arrangements now contributing almost 57.8% of revenue. Add in fee-for-service arrangements, and that figure climbs to 60%.
This trend remains more pronounced among the top 20% of brokers. Indeed, fees, asset-based arrangements and fee-for-service models now generate more than two-thirds of this segment’s revenue. And although fee-for-service revenue still is small, overall, its share of revenue jumped to 4.9% in 2014 for the top 20% of advisors from 1% in 2013. Conversely, transactions now represent just 26.3% of these advisors’ revenue, down from 32.7% last year.
For the remaining 80% of advisors in the industry, the same shift is taking place: transactions now account for just 37.3% of revenue for these brokers, down from 41.5% a year ago. And fee- and asset-based revenue is up to 57.6% from 52.7% in 2013.
In terms of asset allocation, this seemingly precarious investment climate is producing some interesting effects. Overall, brokers report that they have reduced their clients’ direct holdings of both equities and bonds. Equities remain the single-largest holding, at 38.6% for the average broker, but this is down from 39.8% a year ago. Bond allocations have been reduced more drastically, down to 12.7% from 15.9% year-over-year.
Conversely, mutual fund allocations have risen year-over-year, to 24.6% of the average advisor’s book from 21.4% a year ago.
Indeed, it appears that brokers are increasingly looking to professional money managers to help them navigate the particularly tricky markets these days. Not only are mutual fund allocations up, but the allocations to managed products – both third-party and proprietary – are up. This suggests brokers generally are turning to more active management in an effort to position client portfolios to weather increasingly uncertain markets.
Overall, although the brokerage industry is continuing to enjoy solid growth because of continuing market gains, there are indications of a lot of action taking place below the surface among the sales force and in continued shifts in revenue sources and asset allocation.
© 2014 Investment Executive. All rights reserved.