A few weeks of crashing stock prices has changed the landscape within the stock market. Sector strengths have been reconfigured and forecasts made just weeks ago vandalized.
In Canada, consumer staples, telecommunications and utilities have withstood the initial onslaught. On Wall Street, telecoms and utilities remain in bull trends.
Among industries within the U.S. sectors, defence, food/beverages/tobacco, food/staples, and household/personal products continue as bullish. All but one – defence – are within the consumer staples sector.
Whether a full-scale bear market is underway remains uncertain, although market behaviour and economic indications point that way.
Energy and materials have led the way downward in both Canadian and U.S. stock markets due to the collapse of commodities prices. Materials have rallied, but that is thanks to only one industry – gold mining.
Every other sector of the two countries’ markets have been knocked out of bullish trends or pushed further down the slope.
The S&P/TSX composite index has dropped by a maximum of 24% from its September 2014 record high. This touched the halfway point of the preceding 2009-14 rise, often a convincing stop for a dropping market. The Canadian stock market rallied after that January low, but threatens to drop further once more.
Bear signals are mixed
Wall Street made its record high in May 2015 and renewed its drop in early February. At that point, the U.S. market’s maximum loss was 13%, well short of a 20% downward reversal that usually marks a bear market. Other U.S. indices, though, are clearly in bear mode, including small- and mid-capitalization stocks.
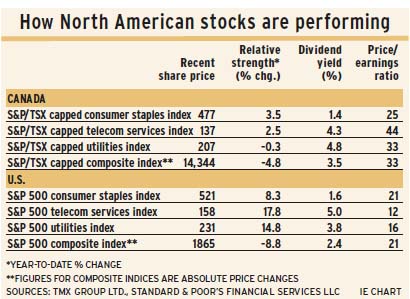
In the 13 weeks ended Feb. 12, the S&P 500 composite index dropped by 8% while the consumer staples index gained by 5%, the telecom services index gained by 12% and the utilities index rose by 7%. All other sectors dropped, led down by financials, which were off by 14%. (See story above.)
In Canada, the S&P/TSX composite index dropped by 5% in the same 13-week period, while consumer staples gained by 3.5%, telecoms by 2.5% and materials by 11%. Utilities dropped by less than 1%. High price/earnings multiples are a risk for these sectors. The big losers: energy is down by 17% and consumer discretionary is down by 12%.
Gold mines’ surge reflected weakness in the U.S. dollar. Whether the price of gold, the controlling factor for mining shares, has made a low is not certain. Until that question has been settled, gold mine stocks are vulnerable.
Trends point downward
Economic trends in the U.S. continue to point downward. Industrial production growth weakened through 2015, then dropped in November and December vs the corresponding periods in the year prior. Corporate after-tax profits dropped in the third quarter to a new low equal to 4.3% of gross domestic product. Employment (not seasonally adjusted) dropped by 2.1% from December 2015 to January 2016.
In addition, the bond yield curve indicates a business slowdown. The curve is flattening, as shown by the yield difference between two- and 10-year U.S. Treasury notes. Recently, the spread was 103 basis points (bps), down from 260 bps in 2013 and 280 bps in 2010.
In Canada, the yield spread between the two- and 10-year Canada bonds has dropped to 66 bps, vs 68 bps in January 2015 and a peak of 164 bps in January 2014.
Strength in interest rate-sensitive stocks, such as utilities and telecoms, suggests the market anticipates little vulnerability to rising interest rates in the near future.
Historical precedent supports this. After 1941, the previous secular low in interest rates, the yield on 10-year T-bonds took four years to rise by 100 bps from the low. After the secular low of 1899, the initial rise in yields was similarly slow.
© 2016 Investment Executive. All rights reserved.