Would you advise a client to invest in a sector in which stock prices and earnings have dropped for the past six years? A sector in which the main product has dropped sharply in price along with slackening demand? Oh, yes, and in which earnings recently have not covered dividend payments at times?
This is a bare-bones outline of the energy sector, one of the three main props of the Canadian stock market – and fortunes of which are reflected closely by the value of the Canadian dollar.
Since 2008, the energy sector gradually has dropped. Prices received by Canadian oil and gas producers are at a large discount to world prices, partly because of export constraints and partly because supply has increased.
Now, after a huge drop in energy stock prices, many analysts and fund portfolio managers in Canada believe energy shares are in the “buy” range. In fact, these sector specialists are encouraged by the energy sector’s sharp rally in mid-October.
The resources cycle, though, may challenge this optimism. Energy prices and commodities have gone through several great bull markets since the Napoleonic Wars of the late 18th and early 19th centuries. In fact, such bull markets have occurred during other wars – the U.S. Civil War, the two world wars and the Cold War. The latest resources boom is an exception. It started in 1999, when the high-tech bull market was ending and China’s expanding demand for metals and energy began.
Now, with China’s economic growth slowing and its banking system stressed, metal prices have dropped well below their peaks – and so have oil prices. North America’s benchmark oil price, for West Texas intermediate grade oil, peaked at about US$140 a barrel in 2008. Recently, it has been in the US$80 a barrel range. In Europe, the benchmark Brent crude price has dropped to US$85 a barrel from US$178 a barrel in 2012.
Market action for both benchmark prices indicates further drops are likely. Saudi Arabia, for long the world’s greatest oil supplier, is the prime influence. In fact, reports suggest the Saudis are trying to force high-cost producers out of business across the globe and to squeeze their enemies – Russia, Iran and the Islamic State. The Saudis’ target price may be US$85 a barrel.
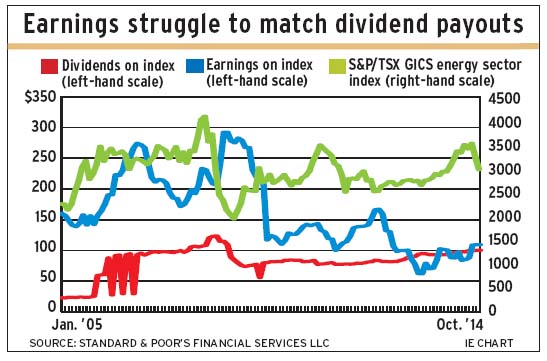
So, are energy stocks good value? Let’s consider some risk factors. There’s no question that energy stocks mostly are cheaper than they were a year ago. But the price/earnings ratio is volatile. Price/earnings multiples on the S&P/TSX GICS energy sector index has dropped to 27. Since 2009, it has ranged as high as 44 and as low as 15. In 2008, this index’s earnings were $292. The high in 2012 was $167. Recently, earnings reached $109 after being as low as $62 in 2013.
The energy index’s indicated dividend peaked at $123 in 2008. This year, the payment recovered to $100 after being as low as $77 in 2011. The price of $1 of dividends from the energy sector again has dropped below $30, where it was a year ago. In early 2011, $1 of dividends cost $44.50. This variability indicates risk; these stocks are not necessarily a stable source of income – with the exceptions being integrated oils and pipelines.
In the U.S., earnings on the S&P 500 energy sector index are expected to drop by 4.3% in the fourth quarter of this year; as of mid-year, these forecasts were in the 10%-10.5% range. For 2015, earnings growth estimates for this index are even lower, at 1.5%, the lowest among the 10 sectors in the S&P 500 composite index.
In Canada, only the tiny oil and gas refining and marketing industry index is above its six-month average price – and stands at 40% higher than it was 12 months earlier. This industry is headed by Parkland Fuel Corp., the revenue for which more than doubled between 2009 and 2013.
Meanwhile, the S&P/TSX GICS energy sector index has dropped by 11% below its six-month average price. The oil and gas storage and transportation industry index, which consists mostly of pipeline companies, lies even with its six-month average price and shows a 21% gain over the past 12 months.
In other parts of the energy sector, price trends clearly are negative. The oil and gas drilling group is 23% below its six-month average price; exploration and production is 17% below; equipment and services is 15% below; and integrated oils is 10% below.
As income providers, pipelines have been favourites for stability – but dividends have exceeded earnings since early 2012. The industry’s index still offers a nice 3.4% yield; however, four years ago, the yield was in the 4% range. The index price level is almost 30 times earnings; four years ago, that multiple was around 20.
Integrated oils account for the largest portion of energy-sector earnings, but exploration and production stocks generate more dividends. Stable dividend growth is the attraction of integrated oil stocks, as the last drop in index payments was in 2009. At 15 times earnings, the integrated index appears relatively cheap – but it did trade below 10 times earnings during the 2008-09 market collapse.
The exploration and production industry’s index offers a nice yield – recently, almost 3.7% -but industry index payouts far exceed earnings. Index data reveal nothing about cash flow, though, which could put this comparison in a better light.
© 2014 Investment Executive. All rights reserved.