Canada’s financial services sector remains an oasis of calm in a world that feels increasingly volatile and chaotic. Amid this stability, the financial advisory business is producing growth where it matters most: in assets under management (AUM) and revenue.
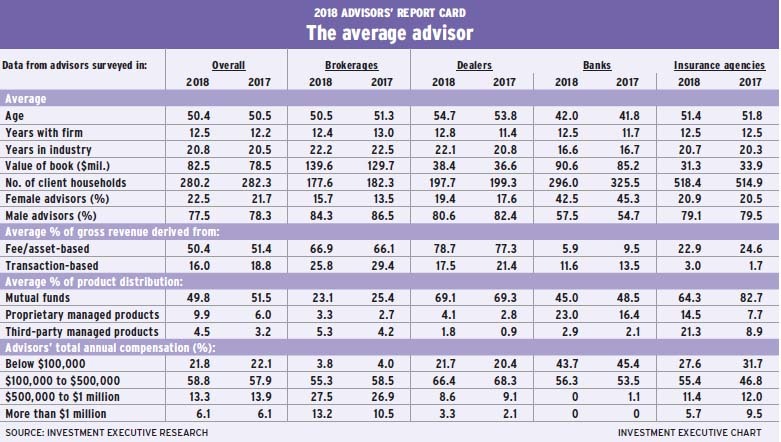
In fact, one of the overarching themes to emerge from Investment Executive‘s (IE) 2018 Report Card series is resilience. Overall, many of the basic metrics were relatively stable year-over-year. However, average AUM across the four distribution channels included in the Report Card series – brokerages, mutual fund dealers, banks and insurance agencies – rose to $82.5 million this year from $78.5 million in 2017.
This growth in average AUM is being powered by the combination of solid equities markets and stronger than expected economic growth over the past year. Certainly, IE‘s data suggest that the growth in AUM isn’t because advisors boosted their client household numbers: the average number of client households that advisors serve was essentially unchanged from last year, at 280.2 this year vs 282.3 last year.
So, as strong markets drive average AUM higher, advisor productivity, as measured by AUM/client household, is on the rise. However, annual compensation among advisors remained relatively steady.
Indeed, the proportion of advisors across all four distribution channels who reported earning less than $100,000 a year dipped to 21.8% this year from 22.1% last year. The majority of advisors reported earning between $100,000 and $500,000, which is up to 58.8% from 57.9% in last year’s surveys. There are 13.3% of advisors who reported earning $500,000-$1 million, down slightly from 13.9% in 2017. And the proportion of advisors who reported that they’re earning more than $1 million a year was unchanged from last year, at 6.1%.
Digging beneath these overall numbers, the data point to a rise in highly compensated advisors within the brokerage channel, indicating that the spoils of higher average AUM flowed through to the bottom line for these advisors.
In addition to compensation remaining fairly steady, there was remarkable consistency in the advisor population itself. Indeed, the basic demographic data collected for this year’s Report Card series showed little difference for the average advisor across the sector, overall. For example, the average age of the advisors in all the distribution channels combined barely changed, at 50.4 years old vs 50.5 years old in 2017. Average tenure in the sector rose slightly, to 20.8 years from 20.5 years in 2017, and advisors’ average tenure with their current firm also rose by that same margin, to 12.5 years from 12.2 years.
The fact that most of these metrics rose slightly year-over-year indicates that the overall advisor population is aging – albeit more slowly than at a natural rate of one year. So, although some new blood is entering the sector, that’s not strong enough to overcome the overall underlying aging trend over the long term.
However, this observation isn’t consistent across all channels in the sector. In fact, declines in average age were reported in both the brokerage and the insurance agency channels, while the average age in the fund-dealer industry, which already had the oldest advisor population on average, increased at the natural rate of a year.
Thus, we can assume that younger people are entering the sector through either the banks, which reportedly had, on average, the youngest advisors by far, or the brokerage channel, in which the average age declined year-over-year.
A positive sign for the brokerage channel was the fact that the proportion of females participating in that survey rose this year. Although brokerages still had the lowest representation of women among the four distribution channels, at just 15.7%, that nevertheless was an improvement over the 13.5% in last year’s survey.
Increasing female representation also was evident among dealers and insurance agencies. In contrast, there were fewer women who participated in the bank channel survey this year, at 42.5% vs 45.3% in 2017, although that channel continues to have by far the highest proportion of women among the four distribution channels.
Along with the brokerage channel’s constructive demographic data, this also was the industry that led this year’s impressive growth in AUM. Average AUM for the advisor population in the brokerage channel rose to $139.6 million this year from $129.7 million last year. Average AUM in the bank and dealer channels also rose, albeit more modestly. In fact, only insurance advisors reported a decline in average AUM; however, investments don’t represent their core business and aren’t as relevant for this channel.
Looking at this year’s data in terms of overall advisor productivity, top producers are leading the growth trends. For the top 20% of advisors, average AUM rose to $194.3 million this year from $177.6 million in last year’s surveys. In comparison, the remaining 80% of advisors reported relatively little growth in average AUM, to $55.6 million this year from $53.8 million in 2017.
The relatively large increase in AUM for the top 20% of advisors overall also came amid a reduction in average client household numbers, as the average client base for this segment of the advisor population dropped to 133.7 this year from 144.4 in last year’s Report Card series.
This combination of higher AUM and lower client household numbers also resulted in a healthy increase in overall average productivity for the top performers, which rose to more than $1.6 million in AUM/client household this year from slightly less than $1.5 million in 2017.
For the remaining 80% of advisors, the relatively small increase in overall average AUM was accompanied by no meaningful change in client household numbers. As a result, overall average advisor productivity increased slightly as well, to $256,757 this year from $238,829 last year.
But while fundamental financial metrics for both segments of the advisor population grew, the basic demographics barely budged. The demographics of both the top 20% and remaining 80% of advisors remained consistent with last year’s data. For example, average age and tenure among the top 20% and remaining 80% of advisors in each industry were essentially unchanged year-over-year.
The impact of the growth in AUM was evident in the account distribution data. For the top 20% of advisors, 55.8% of their accounts reportedly were worth in excess of $1 million. Last year, 47.3% of the top performers’ accounts held at least $1 million, while the single biggest account category that year was $500,000-$1 million, which represented 26.8% of the average book. This year, accounts in the $1 million-$2 million range represented the biggest share of the average book, at 29.2%, among the top 20% of advisors.
The basic shift toward higher-value accounts is similar – even though the AUM totals were smaller – among the remaining 80% of advisors, who reported that their allocation to accounts worth less than $250,000 dropped to 40.5% this year from 47.5% last year.
In contrast, advisors in this segment reported higher allocations to every account category above the $250,000 level. Indeed, allocations to accounts worth more than $1 million among the remaining 80% of advisors rose to 12.9% of the average book from 10.3% last year and 8.1% in 2016.
Asset allocation is another area in which there were signs of a shift within the financial services sector. For the top- performing advisors, allocations to mutual funds and third-party managed products hardly changed from last year, but the use of proprietary managed products rose to 7.2% this year from 4.5% last year.
Similarly, even though the remaining 80% of advisors reported using more third-party managed products, which accounted for 4.6% of the average book vs 2.9% last year, this advisor segment’s exposure to proprietary products was more than double that, accounting for 10.2% of account holdings, up from 6.7% last year.
Overall, the data for this year’s Report Card series revealed a financial advisory business that looks much the same this year as it did a year ago in terms of age and experience – while AUM and productivity were on the rise. As well, asset allocation trends are shifting on the strength of these metrics while compensation remained steady.