
Canadian firms created the first ETF, the first bond ETF and, this past February, the first direct-custody Bitcoin ETF. Assets under management (AUM) in the cryptoasset ETF category hit $6.7 billion as of Oct. 31, according to National Bank Financial Ltd. And between July 2017 and July 2021, the AUM of Canada-listed ETFs increased at a compound annual growth rate of 24.6%. This helped push ETFs’ market share to 13.7% of all investment funds, up from 8.5%, during that period, according to the Canadian ETF Association (CETFA).
Issuer landscape diversifies
As of July 31, Canadian ETFs had $291.9 billion in AUM, according to National Bank Financial Markets, while CETFA pegged the AUM at $314.3 billion. The reason for this discrepancy is that National Bank doesn’t count ETFs held by other ETFs to avoid double counting.
Manufacturer market share, as measured by Canada-listed ETF AUM
Click image for full-size chart
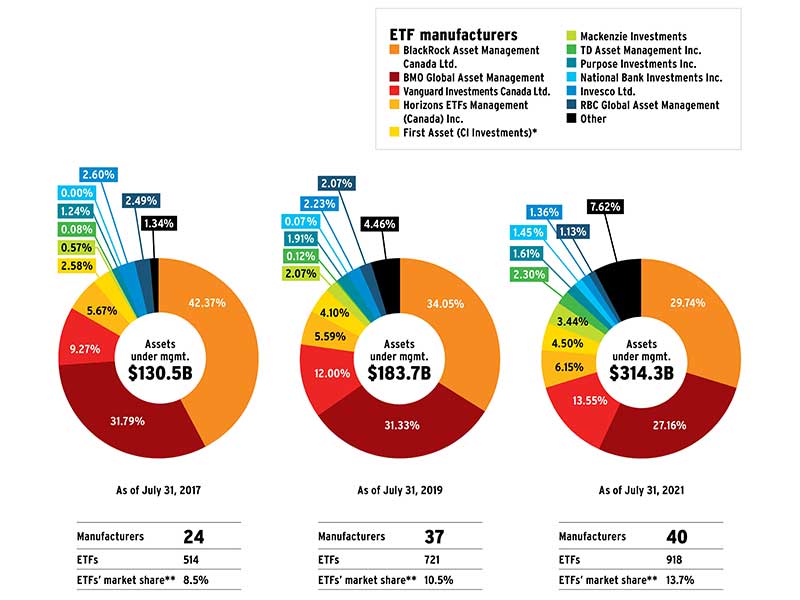
Figures may not add up to 100% due to rounding
Source: Canadian ETF Association
*includes assets from WisdomTree Asset Management Canada Inc., which was acquired by CI Financial Corp. in 2020
**market share as a % of all investment funds
Net creations see steady rise
From December 2018 to March 2021, institutional investors’ holdings increased to 39.1% of all ETFs held by Canadian investors from 33.2% (includes both domestic- and foreign-listed ETFs), according to CETFA and Investor Economics. However, from January to May 2021, only 32% of all ETF trades on a Canadian stock exchange were made in blocks of 10,000 units or more, according to TD Securities Inc. — suggesting that 2021’s high trading volume was driven primarily by retail investors.
Canadian ETF positive net creations by issuer (as a % of net industry creations)
Click image for full-size chart
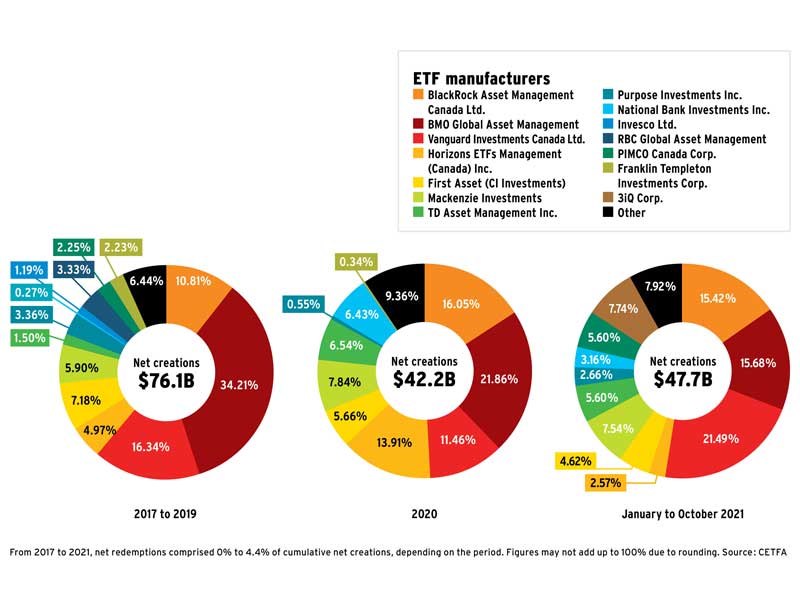
From 2017 to 2021, net redemptions comprised 0% to 4.4% of cumulative net creations, depending on the period. Figures may not add up to 100% due to rounding.
Source : CETFA
ESG fund sales surge
The market share of liquid-alternative ETFs increased to 2.31% from 0.45% between Dec. 25, 2020 and Sept. 3, 2021, according to TD Securities Inc. From Jan. 1 to Dec. 25, 2020, net creations of these thematic ETFs were $596.3 million, ballooning to $5.54 billion from Jan. 1 to Sept. 3, 2021. Total AUM for liquid-alt ETFs amounted to $7.52 billion as of Sept. 3.
Net creations of environmental, social and governance-focused ETFs (AUM recorded at the end of each period)
Click image for full-size chart
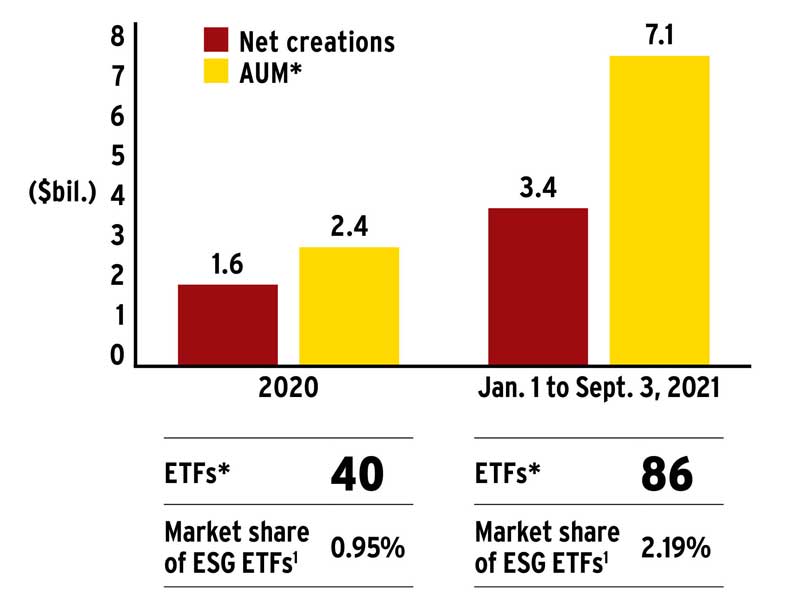
*from Dec. 25, 2020, to Sept. 3, 2021
1as a proportion of total AUM held in ETFs
Source: TD Securities Inc.
Active management stakes its claim
Management fees for actively managed ETFs are higher than those for index ETFs, according to TD Securities Inc. In the equity category, the average management fee for active ETFs was 0.63% and only 0.42% for index ETFs as of May 4. In the fixed income category, the average fee for active ETFs was 0.51%, compared with 0.27% for index ETFs. The average asset-weighted management fee was 0.28% for equity ETFs and 0.29% for bond ETFs, indicating that investors prefer low-fee ETFs.
Discretionary indexed ETFs were in higher demand in 2021, as illustrated in the net creations chart. In addition, between Dec. 25, 2020 and Sept. 3, 2021, their share of total Canada-listed ETF AUM rose to 9.7% from 8.2%, according to TD Securities Inc.
Breakdown of ETF AUM and net creations by management style
Click image for full-size chart
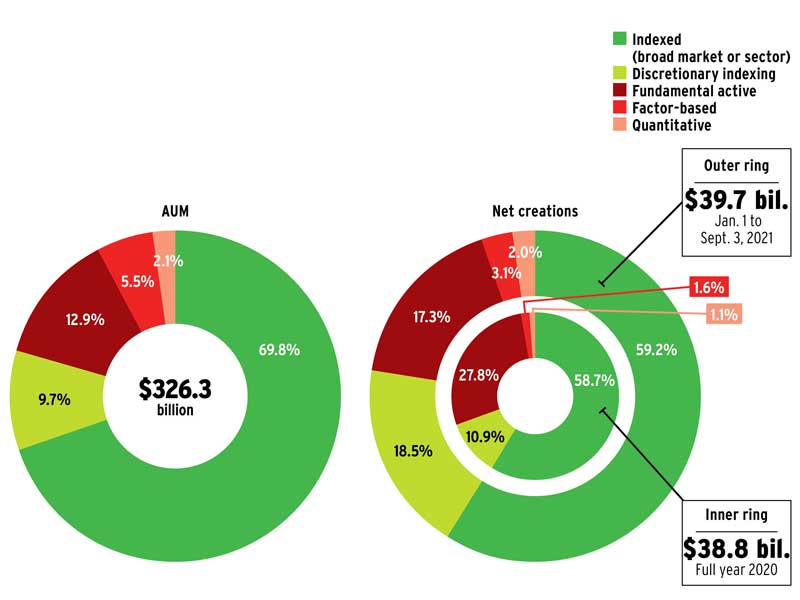
Figures may not add up to 100% due to rounding
Source: TD Securities Inc.