This article appears in the September 2023 issue of Investment Executive. Subscribe to the print edition, read the digital edition or read the articles online.
Despite strengthening headwinds in financial markets, respondents to Investment Executive’s 2023 Dealers’ Report Card posted impressive gains in assets under management (AUM), driven primarily by their growing client rosters.
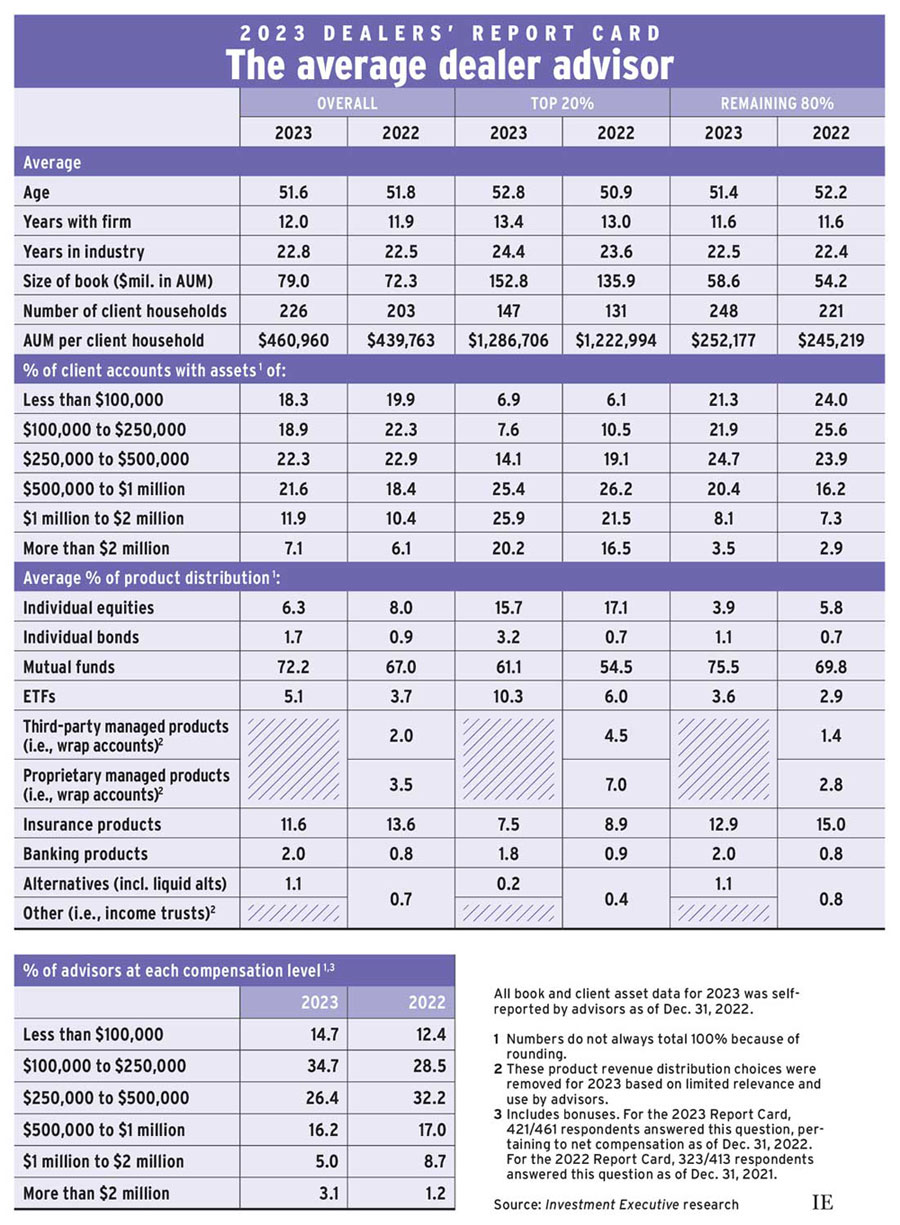
The average dealer advisor in our survey reported AUM of slightly more than $79 million as of Dec. 31, 2022, up from $72.3 million the previous year. This increase came alongside double-digit growth in the average number of client households, which rose to 226 this year from 203 last year.
As a result, the average AUM per client household reached almost $461,000, up from slightly less than $440,000 in 2022.
The top 20% of dealer advisors (as measured by AUM per client household) generated stronger gains, in both assets and productivity, than the remaining 80% of advisors. Among the top 20%, average AUM rose by 12.4% to $152.8 million this year, from $135.9 million last year. The number of client households rose 12.2%, to 147 from 131.
Among the remaining 80% of dealer advisors, average client households increased to 248 from 221 last year (an increase of 11.6%), but AUM growth was notably lower, rising by just 8.1%, to $58.6 million from $54.2 million in 2022.
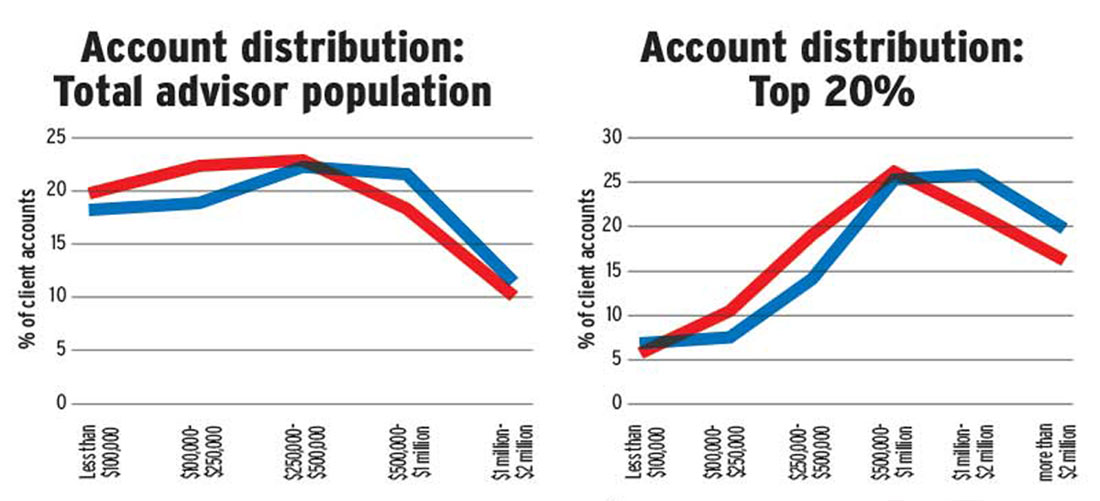
Dealer advisors generally reported that high-value accounts made up a larger share of their books than in last year’s research. Accounts worth more than $500,000 made up 40.6% of the average book, versus 34.9% last year. The share of accounts worth $1 million or more was 19.0% this year, up from 16.5% in 2022.
Among the top 20% of advisors, accounts worth at least $1 million represented almost half of the average book (46.1%), up from 38.0% last year. This increase of eight percentage points was about evenly split between the largest accounts (those worth more than $2 million) and accounts in the $1 million–$2 million range. The largest accounts made up one-fifth of the average top performer’s book (20.2% versus 16.5% last year).
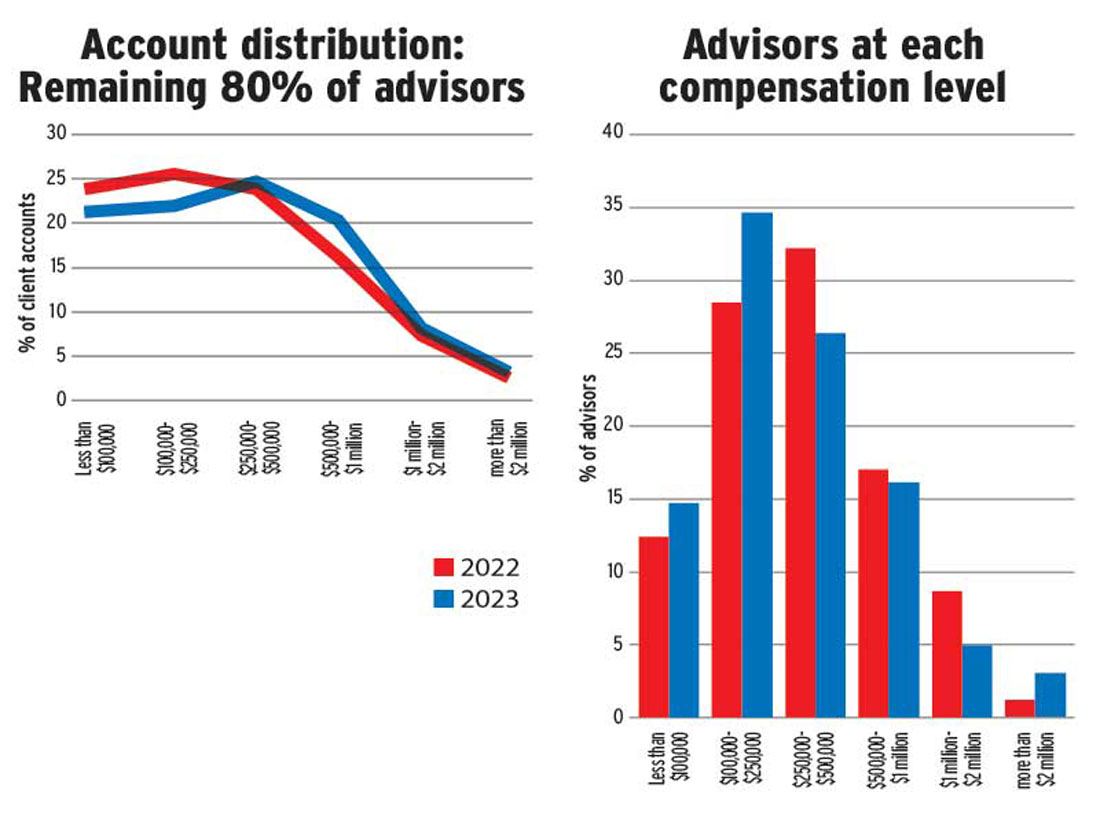
The rest of the industry also increased its exposure to more valuable accounts, but starting around the $250,000 mark. While the lower 80% of the advisor population grew its share of accounts worth at least $1 million, that increase was relatively modest — to 11.6% from 10.2% last year. The more significant gains came in the $250,000–$1 million range, representing 45.1% of the average book, up from 40.1% last year.
This growing traction with higher-value clients didn’t necessarily flow through to the bottom line, however. Despite the overall growth in advisors’ books and a more lucrative account mix, advisors’ reported compensation skewed a bit lower in this year’s Report Card.
The proportion of advisors who reported annual compensation of less than $250,000 jumped to 49.4% this year, from 40.9% last year. And, while the largest segment of advisors fell into the $250,000–$500,000 compensation category last year (32.2%), the biggest segment this year was advisors making $100,000–$250,000 (34.7%, up from 28.5% last year).
The fact that dealer advisors generally earned less income year over year — despite managing higher asset and client loads — is perhaps to be expected in an environment marked by high inflation, escalating industry operating costs and uncertain markets.
Click image for full-size chart
Click image for full-size chart
Click image for full-size chart