This article appears in the May 2022 issue of Investment Executive. Subscribe to the print edition, read the digital edition or read the articles online.
Since the start of the pandemic, retail investment assets have risen sharply. For the firms included in Investment Executive’s 2022 Brokerage Report Card, that trend was reflected in the books of the average investment advisor. Based on advisors’ self-reported client book data, both assets under management (AUM) and productivity were up significantly from last year.
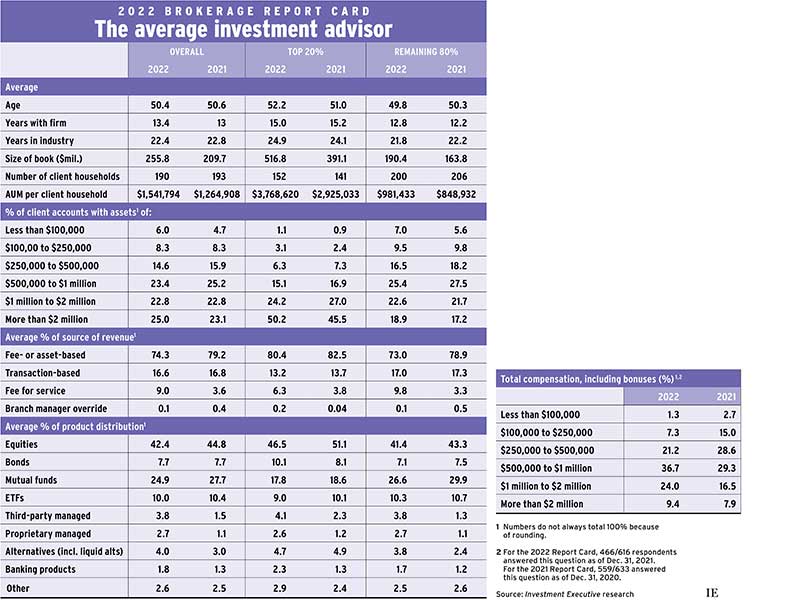
The average broker reported their book value rose by about 22%, climbing to $255.8 million this year from $209.7 million last year (book values were given as of Dec. 31, 2021 and 2020, respectively).
The industry’s spectacular growth followed an exceptionally strong recovery from the initial economic damage inflicted by the pandemic. Stock markets had a banner year in 2021: the S&P/TSX index gained 22%, the S&P 500 rose by 27% and major European markets posted double-digit gains.
Book values grew largely thanks to flows in financial assets and rising markets, not to expanding client bases. The average broker served 190 client households, about the same as the 193 served in the 2021 Report Card.
Therefore, the rise in assets also was behind the increase in productivity (measured as AUM per client household). Average productivity rose by about 22% to $1.54 million from $1.26 million last year.
Gains were even stronger among the industry’s top producers. Our research — which divides the industry into the top 20% of brokers and the other 80% based on AUM per client household — indicates that average book value for the top brokers was up to $516.8 million as of Dec. 31, 2021, a 32% gain from a year earlier.
For the industry’s top producers, this impressive gain in assets came from a combination of rising markets and more clients: the top 20% of brokers averaged 152 households served, up from 141 in last year’s Report Card.
For the other 80% of advisors, assets and productivity were both up strongly from last year, but their gains weren’t as robust. Average book value for this group rose to $190.4 million in this year’s Report Card from $163.8 million in 2021, an increase of about 16%. Average productivity rose at a similar rate, with AUM per client household coming in at almost $1 million, compared with less than $850,000 last year.
Client household asset distribution is skewing toward larger households. The top household asset category in our Report Card (more than $2 million) represented the largest share of the average book at just over 25%, up from 23.1% in last year’s research.
Among the industry’s top performers, half of their books were devoted to accounts worth at least $2 million (up from 45.5% last year). The other 80% of brokers also saw gains in the proportion of client households in the top asset category (18.9%, up from 17.2% last year).
And client accounts worth at least $1 million are increasingly the norm across the industry. Among the other 80% of brokers, client accounts worth $1 million or more represented 41.5% of the average book, up from 38.9% in 2021.
This growing exposure to high-value accounts, increased productivity and dramatic asset expansion bolstered the bottom line of many brokers. Most investment advisors reported that their total compensation last year topped the $500,000 mark. Indeed, the share of brokers who reported earning less than $500,000 dropped to less than one-third (29.8%) for the 2022 Report Card from almost half (46.3%) in last year’s research.
The largest compensation category for brokers in our Report Card this year was the $500,000 to $1 million range, which is home to 36.7% of brokers, up from 29.3% in the 2021 research.
Alongside the upshift in industry compensation, this year’s survey also revealed a notable change in brokers’ revenue mix. Fee-and asset-based revenues remained the dominant source of revenue at 74.3% of the average book, followed by transactions at 16.6%. However, the industry reported significant growth in its third-biggest source of revenue: fee-for-service arrangements, which jumped to 9.0% from 3.6% of the average book in 2021.
Both top performers and the rest of the industry reported greater reliance on fee-for-service revenues. For top-producing brokers, service fees contributed 6.3% of revenues, whereas for the rest of the industry the share was 9.8%.
While brokers’ books evolved in several ways over the past year, their product allocation didn’t change much. Direct equities holdings continued to make up the largest portion of all advisors’ product mixes, followed by mutual funds and ETFs — together, these categories comprised 77.3% of the average book. However, that was down from last year, when those three product types represented 82.9% of the average book.
One likely destination for assets that drifted out of those categories was managed products. Advisors’ reported allocations to third-party managed products more than doubled to 3.8% from 1.5% in 2021. Similarly, the share devoted to in-house managed products jumped to 2.7% from 1.1%. While managed products remain a small portion of the average book, allocations to these products rose sharply over the past year.
These shifts, however, are taking place at the margins of most brokers’ books. The real story is that the shifts occurred during a truly impressive recovery. Looking ahead, the challenge for the industry will be retaining these gains as the economic and financial climate moves from gangbusters growth to greater uncertainty.
Click image for full-size chart