This article appears in the June 2023 issue of Investment Executive. Subscribe to the print edition, read the digital edition or read the articles online.
Over the past year, interest rates have risen, inflation has soared, market volatility has surged and economic uncertainty has spiked. But you wouldn’t know that by looking at the book of the average investment advisor.
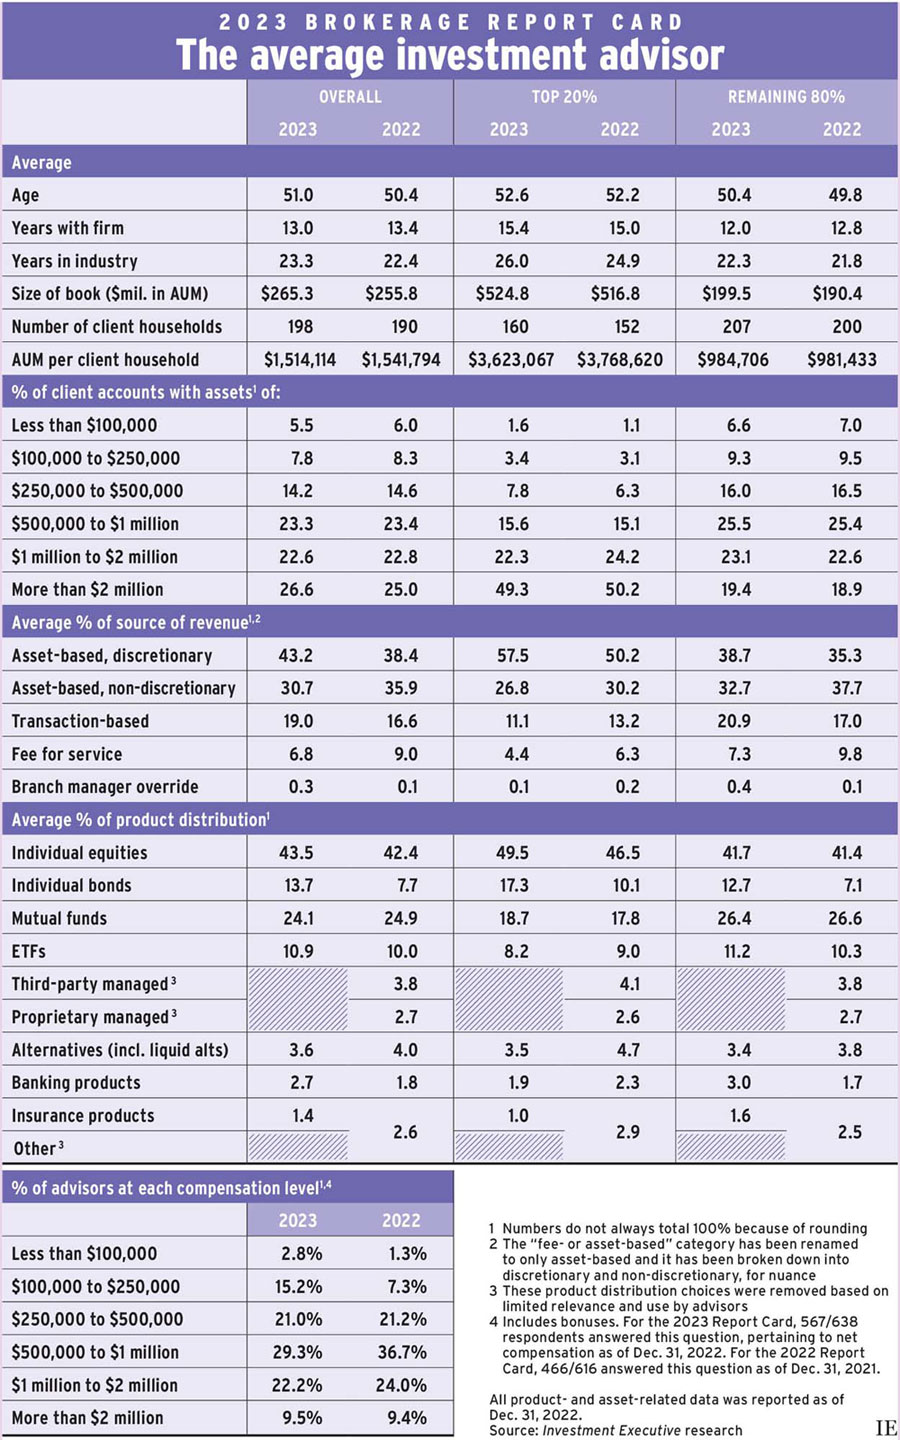
The average advisor in Investment Executive’s 2023 Brokerage Report Card managed to grow their business, reporting a modest gain in assets under management (AUM) while adding to their client rosters and largely maintaining productivity. (All product- and asset-related data was reported as of Dec. 31, 2022.)
The average brokerage advisor saw AUM rise by 3.7% to $265.3 million this year, from $255.8 million in last year’s survey. This growth was generated in spite of several headwinds. Household net worth in Canada dropped by 4.7% over the course of 2022, and mutual fund AUM declined by 13.1%, amid a combination of market effects and $44.1 billion in net redemptions, according to the Investment Funds Institute of Canada.
But advisors were able to recruit more client households. The average advisor’s roster of households grew to 198 in the 2023 Report Card compared with 190 the previous year, slightly outpacing the asset growth rate.
As a result, the productivity of the brokerage advisors in our research (measured as AUM per client household) edged downward. This year, average AUM per household was $1.51 million, down slightly from $1.54 million in last year’s research.
Trends around AUM, households and productivity were more pronounced among top-producing advisors. In fact, the top 20% of advisors (as measured by AUM per household) epitomize the trend of rising client numbers driving higher AUM.
For the top 20% of advisors, average AUM ticked up to $524.8 million in this year’s research from $516.8 million last year. This 1.5% rise comes alongside a 5.5% increase in client numbers; the top producers averaged 160 client households this year, up from 152 in 2022’s research.
As a result, the average AUM per household for the top 20% of producers slipped to slightly more than $3.6 million this year, from slightly less than $3.8 million last year.
Average AUM and household numbers rose year over year for the remaining 80% of advisors, too. This group saw average AUM rise by almost $9 million year over year and added seven new households on average, resulting in a small increase in productivity for the segment.
The remaining 80% of advisors also saw their share of client accounts worth more than $1 million rise to 42.5% in this year’s Report Card from 41.5% last year. That increase was almost evenly divided between accounts worth more than $2 million and accounts in the $1 million–$2 million range.
Among top producers, however, smaller accounts grabbed a slightly larger share of the average book. While accounts worth more than $2 million still represent the largest category for the top 20% of advisors, the share of accounts over $2 million slipped to less than half of the average book, from slightly more than half in last year’s Report Card. The share of accounts worth more than $1 million also dropped.
Alongside the shifts in account distribution trends, product distribution changed, too. (Note that this year’s Report Card removed four product categories with limited relevance, which did not materially affect overall results.)
Direct bond allocations jumped over the past year. Among all brokerage advisors surveyed, bond holdings almost doubled to 13.7% in this year’s Report Card, compared with 7.7% last year.
This trend was evident among both the top 20% and the remaining 80% of brokerage advisors. For top producers, bond allocations rose to 17.3% from 10.1%. Among the remaining 80% of advisors, their allocation climbed to 12.7% from 7.1%.
Advisors’ revenue sources shifted over the past year as well. Overall, advisors reported that asset-based discretionary accounts were their chief source of revenue at 43.2%, up from 38.4% last year. These discretionary accounts were even more important for top producers, representing 57.5% of revenue — up from 50.2% a year ago. That’s well ahead of the 38.7% of revenue for asset-based discretionary accounts reported by the remaining 80% of brokerage advisors.
Still, in a new development, those accounts are now the largest revenue source for the non-top advisors. Last year, that honour went to asset-based non-discretionary revenue, which accounted for 37.7% of the remaining 80% of advisors’ businesses. That category dropped to second place (32.7%) this year.
The remaining 80% of advisors also relied more on transactions than in years past, with that share of revenue rising to 20.9% this year, from 17.0% a year ago. Conversely, the top 20% of producers further reduced their reliance on transactions to just 11.1% of revenue, down from 13.2% last year.
Regarding compensation at brokerages, the share of advisors at the top of the pay scale (those earning more than $2 million per year) held steady year over year. But average compensation seems to have dropped as markets dropped. There were reductions in the share of advisors in the $1 million–$2 million category (22.2% this year vs. 24.0% last year) and in the $500,000–$1 million category (29.3% vs. 36.7%). The share of brokerage advisors who earned less than $250,000 per year more than doubled to 18.0% this year from 8.6% last year.
Click image for full-size chart