Corporate canada – apart from financial services companies – suffers from a long-term problem: declining profitability. In essence, revenue growth has been slowing and profits have dropped recently.
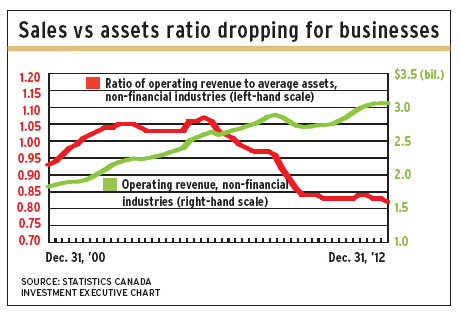
Non-financial corporate Canada also is becoming less efficient. Sales in relation to assets are dropping. Put another way, the increase in assets is not being matched by an increase in sales – and these sectors may also be underdepreciating their capital assets.
In the other half of corporate Canada – financial services and insurance firms – profitability has been rising since the financial crisis of 2008-09, although it remains below the peak level of 2005.
These conclusions come from Statistics Canada’s (StatsCan) latest analysis of figures on Canadian businesses, entitled Financial Statistics for Enterprises. This latest preliminary report covers the final calendar quarter of 2012.
StatsCan figures correlate most closely to earnings and dividend figures of the S&P/TSX 60 index, the Toronto Stock Exchange’s large-cap index. The data have little or no correlation with the S&P/TSX composite index, the S&P/TSX completion index (mid-caps) or the S&P/TSX small-cap index.
Investment Executive has analyzed the StatsCan numbers on a moving 12-month basis to eliminate seasonal jolts that show up in quarter-only figures.
In the 12 months ended Dec. 31, 2012, assets for all sectors increased by 8.7% from the year prior to $8.3 trillion while operating revenue rose by 5.6% to $3.4 trillion.
But the data show sharp weakening in all sectors’ revenue growth since 2009. In 2006-09, operating revenue gained year-over-year – although in low double-digit percentages.
In fact, earnings trends for all sectors have been unsteady. Net income rose by as much as 48% during the 2003 economic recovery, but dropped by as much as 25% in the 2009 recession and rose by as much as 37% in 2010. The most recent year-over-year change is a drop of 9.5%.
Dividend payments have been flat since rising to a high in 2008. Dividends, calculated as yield on equity, peaked at 8.1% in 2008. In 2012, dividend yield on equity dropped to 5.1%, the lowest in 10 years.
Non-financial sector assets grew by 4.5% to $3.8 trillion in 2012, and operating revenue rose by 2.5% to $3.1 trillion. Financial/insurance sector assets rose by 3.8% to $4.5 trillion while operating revenue rose by 1.2% to $322 billion.
For non-financial businesses, profitability has dropped, as has turnover (sales as a ratio of assets). And with the dropping rate of depreciation and the continued rise in capital investment, the free cash-flow margin has dropped.
Meanwhile, return on equity (ROE) for non-financial businesses dropped to 9.5% in 2012. In 2004-08, ROE ranged as high as 13.7%. It fell to 8.6% in 2009, then rose again to 12.1% in 2011.
Non-financial earnings and cash flow have been helped by the drop in depreciation rates. In 2012, depreciation was 8.7% of capital assets vs a high of 12% in 2003.
The drop in efficiency – sales as a ratio of assets – for non-financial businesses has been steady since 2006. In that year, the ratio reached a decade high, at 106%. In 2012, sales dropped to 82% of assets.
Non-financial businesses’ dividends have risen from a decade low in 2007. Dividends as ROE rose from 3.8% in 2007 to 6.6% in 2011, then dropped to 5.2% in 2012.
Profit trends differ in the two largest portions of the non-financial sectors – oil and gas extraction and support industries, and manufacturing. However, profitability for both has been volatile.
Oil and gas ROE has dropped since 2000, when it averaged 24%. After a plunge to 5% in 2002, ROE rallied to 20.8% in 2006. Since then, it has dropped to a measly 1.5% in 2012.
Offsetting this has been relative stability in cash flow. The oil and gas sector’s cash-flow margin as a percentage of revenue was 34.9% in 2001, dropped to 19.3% in 2009, then recovered to 21.8% in 2012.
Capital spending in the oil and gas sector soared to $54.7 billion in the 12 months ended June 30, 2012, from $8.5 billion in 2005. However, spending tapered off to $48.8 billion for all of 2012.
Manufacturing ROE since 2002 has ranged between a low of 5.5% and a high of 11.5% in 2011. In 2012, it dropped to 7.1%. But cash flow for manufacturing also has been more stable. It was at 7.3% in 2012, the highest since 2002 and up from a low of 2.7% in 2009.
Manufacturing operating revenue rose by 11% in 2011, which was the highest in a decade. In 2012, the gain was only 1.8%.
For financial services and insurance companies, ROE dropped to 7% in 2009 from 13% in 2007, then recovered to 9.1% in 2012. Return on average assets figures followed a similar path, peaking at 1.8% in 2007, dropping to 1.02% in 2009, then finishing 2012 at 1.2%.
Over the past decade, asset growth for financial services and insurance firms was strongest in 2011, at 17.4% year-over-year. Operating revenue growth peaked at 12.4% during 2007, but reached only 1.2% in 2012.
© 2013 Investment Executive. All rights reserved.