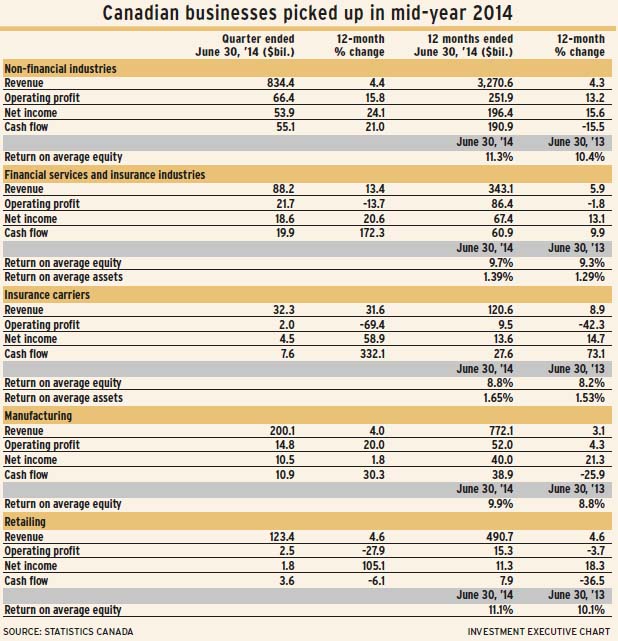
Perhaps the business recovery is actually stronger than it seems. According to Statistics Canada’s latest report on corporate Canada – for the quarter ended June 30, 2014 – non-financial businesses had their second-largest earnings gain in four years. And revenue and net income for the 12 months ended June 30 reached record highs.
In the financial services sector, quarterly earnings by insurance carriers surpassed their previous high, reached in 2009, as net income jumped by 59% vs the corresponding quarter a year before.
Overall, the financial services sector continued its growth since 2009, with net income up by 21%. That was better than the 17% rise in the quarter ended March 31, 2014, and the 18% gain in the quarter ended Dec. 31, 2013.
Non-financial business revenue grew by more than operating expenses for the fifth consecutive quarter, reaching a record $834.4 billion. In the past four quarters, non-financial industry revenue has grown year-over-year in the 4%-4.5% range.
However, not all trends are positive in the non-financial industries. A troubling trend in turnover – the ratio of sales to assets – continues. Sales dropped to 0.8 of average assets in the 12 months ended June 30, 2014. The last time the turnover ratio was 1.0 (annual sales equalling average annual assets) was in 2006.
Dividends paid in the quarter ended June 30 by non-financial businesses reached $24.8 billion, up by 23% from the corresponding period in the prior year. In the 12 months ended June 30, dividends totalled a record $93.7 billion.
Dividend payments by the financial and insurance group also rose by 21% in the quarter ended June 30 to a new quarterly high of $9.1 billion. This gain followed a 13% rise in the previous quarter.
According to StatsCan, non-financial industries account for 46% of all business enterprises, the rest being financial services and insurance industries. StatsCan categorizes 22 industries overall, 17 within the non-financial group and five in the financial services group.
Insurance carriers, the third-largest by assets of all 22 industries, has been having problems with operating costs. After dropping to 81% of revenue in the 12 months ended Sept. 30, 2013, operating costs climbed to 92% of revenue in the 12 months ended June 30.
However, during that same period, insurers’ net profit on average assets climbed back to 1.65%, matching the preceding high in 2012. In the 12 months ended Sept. 30, 2013, return on assets reached a low of 1.4%. That’s a long way below the insurers’ peak-year return of 3.4% in pre-recession 2006.
In the stock market, the S&P/TSX insurance index divides into three subindustries: life and health insurers; multi-line insurers; and property and casualty (P&C) insurers. In recent years, life and health insurance has accounted for 87%-89% of industry earnings and a similar proportion of dividends.
Nevertheless, the best growth has been in the multi-line insurance and P&C insurance subindustries. Between Nov. 30, 2008, and Nov. 30, 2014, the overall insurance index rose by 25%, with the life and health subindustry up by 18%. In contrast, multi-line insurance rose by 61% while P&C rose by a significant 131% during that period.
As of Nov. 30, 2014, multi-line and P&C each accounted for 5.4% of 12-month earnings. P&C accounted for 6.7% of indicated annual dividends; multi-line insurers, 6.3%.
Manufacturing, the second-largest industry in terms of assets, has, by one measure, climbed back from the effects of the 2008-09 recession: net margin is above pre-recessionary highs. In the 12 months ended June 30, the ratio was steady, at 5.2%. Turnover has improved from a low in 2009. In the 12 months ended June 30, the sales/assets ratio was 0.87.
Meanwhile, the retailing sector, which had been struggling, continues to slide. Turnover dropped to a new low (2.0) in the 12 months ended June 30. Operating profit dropped to 3.2% of sales, the lowest since 2005.
The big jump in retailing’s net income in both the quarter and 12 months ended June 30 is due to an exceptionally low return in the corresponding periods the year before, the result of a big quarter-over-quarter rise in operating costs in 2013.
© 2015 Investment Executive. All rights reserved.