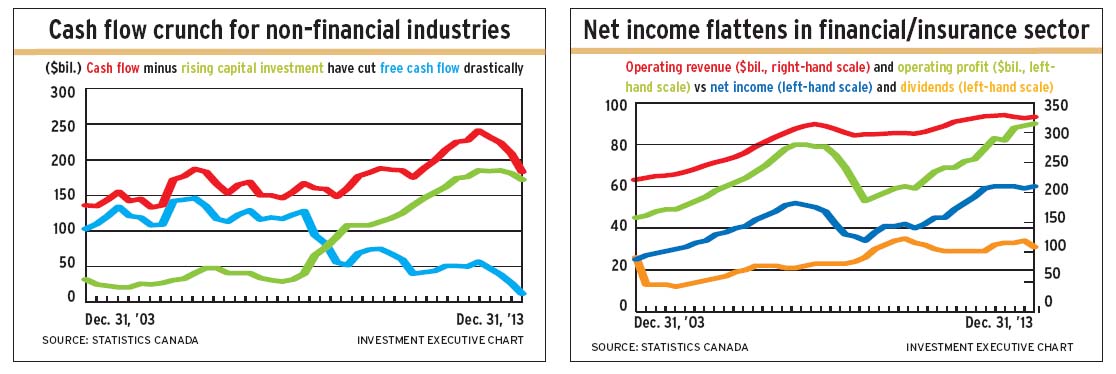
Non-financial businesses in Canada entered 2014 with a problem: a sharp drop in cash flow in 2013 that squeezed free cash flow to the lowest level in seven years.
That’s not the only issue facing non-financial operations, which also have a continuing problem with efficiency, as turnover (a.k.a. sales per dollar of assets) continued to drop.
According to Statistics Canada (StatCan) data, earnings of both financial services and non-financial companies flattened in 2013. Still, the stock market – commonly thought to be a leading indicator that looks six months to a year ahead – seems unconcerned about the flat earnings and non-financial industries’ dropping cash flow and lower asset turnover.
The S&P/TSX composite index’s 4% gain in 2012 hinted at a less than wonderful year for corporate Canada in 2013. And that’s what happened: the financial services sector’s return on assets was below average and earnings growth flattened while the non-financial sectors’ collective revenue and profit growth continued to slow last year.
The S&P/TSX composite index’s 9.6% rise in 2013 implies the market expects stronger growth this year. The market’s first-half gain of 11.2% in 2014 strengthened that assumption. (StatCan has yet to issue a preliminary report on 2014 business results.)
An analysis of StatCan’s quarterly reports on Canadian business enterprises shows revenue of non-financial enterprises gained by 2.3% in 2013. That continues a pattern of slowing growth since 2011. Revenue for 2013 was almost $3.2 trillion in total.
Net income rose by 6.1% in 2013 to $173 billion. However, the trend has been no growth since 2011, when net income was level with that reported in 2013.
Return on equity (ROE) of non-financial businesses averaged 11.2% for the 10 years ended Dec. 31, 2012. ROE dropped below that average in 2013 to 10.4%.
In contrast, non-financial industries were able to generate more profit per dollar of revenue in 2013. Net margin was 5.5%, vs an average of 4.8% over the preceding 10 years.
Cash flow is a challenge. After a sharp increase in the second half of 2011 through 2012, cash flow dropped back to the mid-2011 level. This squeezed free cash flow close to zero in 2013 because capital spending increased more than six times between 2008 and mid-2013.
Should cash flow continue to drop, capital spending would have to be cut in order to provide positive free cash flow – the money available for dividends and reinvestment.
In 2013, non-financial industries obtained 80¢ worth of revenue for each $1 of assets. This is a big drop in efficiency since 2006, when asset turnover peaked at $1.06 in revenue per $1 of assets.
Despite these negatives, the non-financial enterprises’ collective balance sheet has been strengthening. In 2013, reinvested profits were at a 10-year high, with retained earnings equal to 19.3% of shareholders’ equity. Total debt equalled 53% of shareholders’ equity, down from 68% in 2000-01.
As for financial and insurance businesses (collectively, the financial services sector), the other half of corporate Canada, they have improved their profit margins but not their profitability.
In 2013, the financial services sector translated each $1 of operating revenue into 18.5¢ of net income. That was the highest net margin in the past 13 years.
Meanwhile, ROE for this sector dropped to 9.3%. In the 10 calendar years ended 2012, ROE averaged 9.8%. It ranged between 10% and 13% in the 2004-08 period.
Similarly, return on average assets – a key measure in this sector – flattened at 1.3% in 2013. Again, this is below the returns in the 2004-08 period, which peaked at 1.81%. Over the 10 years ended Dec. 31, 2012, return on assets averaged 1.36%.
At yearend 2013, StatCan’s preliminary estimate of financial services sector assets was $4.73 trillion, up by 3.6% in the year. This increase was smaller than the 4.2% increase in assets in 2012 and the 17.5% gain in 2011.
For the non-financial sectors, StatCan’s asset estimate was $3.99 trillion collectively, 3% above the 2012 figure. Assets increased by 6.4% in 2012 and 8.4% in 2011.
© 2014 Investment Executive. All rights reserved.