The end of October is the season for banks to tidy up their accounts and produce their massive annual reports. Although balance-sheet stress tests are matters of prime concern these days, balance-sheet strength is not really an issue for Canada’s chartered banks.
Earnings growth always is an issue, but, for banks, there’s more to the equation than earnings in determining this. The banks’ balance sheets also are an element of the story.
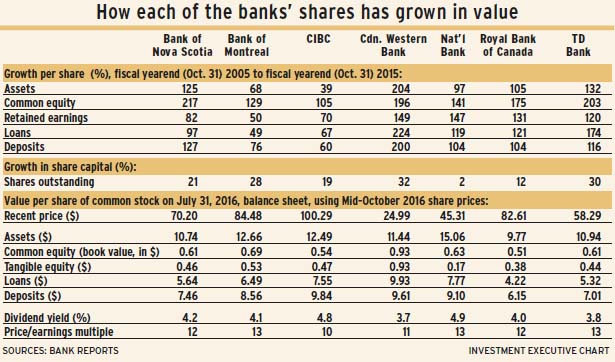
More than that, looking at banks’ balance-sheet growth on the basis of value per share sharpens your analytical focus. Knowing that a bank’s total assets or earnings have grown by such and such percentage is good, but what counts for your client is each individual share’s portion of total earnings.
Dilution can be an issue, as the number of outstanding shares rises year after year for most banking institutions. National Bank of Canada is the only one without this issue, as its outstanding shares, adjusted for a stock split, have increased by only 2% in the period covered in the accompanying table – the 10 years from the banks’ October fiscal yearends from 2005 to 2015.
The analysis covers the seven largest banks, which includes the Big Six plus Canadian Western Bank (CWB). And CWB, the smallest, is the bank that led in balance-sheet growth – as well as in total assets, deposits and loans growth per share.
Mind you, CWB, which is based in Edmonton, rode the crest of the oil boom during the 10 years in the analysis. CWB’s next 10 years no doubt will be more difficult after the bank tripled its assets per share in the past decade.
The banks’ fundamental business remains taking deposits and lending money, despite their “all things to all people” approach through insurance, stock brokerage and money management. Hence, the table shows how loans and deposits have grown between 2005 and 2015 on a per share basis.
In building the shareholders’ stake (as shown by growth in equity [book value per share]), Bank of Nova Scotia beat both Toronto-Dominion Bank and CWB. All three tripled or almost tripled their book value per share.
Canadian Imperial Bank of Commerce (CIBC) trailed the pack in growth of both assets and deposits. Although CIBC’s common equity doubled in 10 years, the bank still trailed in book value growth. Bank of Montreal was last in loan growth per share.
What your clients get for each dollar invested in a bank’s stock comes in a range of values. The table shows July 31, 2016, balance sheets’ value per dollar invested, based on mid-October share prices.
By this measure, National Bank stands as the best bargain: each dollar of share price buys $15.06 in total assets. A similar bargain is CWB as a dollar invested in each share buys 93¢ in shareholders’ equity, another comparative bargain. A buyer also obtains the most loans (an asset) and deposits (a liability) per dollar invested at CWB’s recent stock price.
There are two more measurements in the table: growth in retained earnings and in tangible common equity per share.
Retained earnings – reinvestment of profits – can be viewed as a measure of both strength and growth. Notably, four banks more than doubled their retained earnings per share in 10 years.
The banks’ tangible equity (book value) shows that intangibles, such as goodwill, represent a significant portion of their shareholders’ equity.
© 2016 Investment Executive. All rights reserved.