Sooner or later, a bear market will claw into stock prices. The effect will be uneven, as not all industries and stocks are affected to the same extent.
Some sectors and industries will drop heavily while others will put up strong resistance to the declining trend – and although some sectors have this reputation, it’s not entirely deserved.
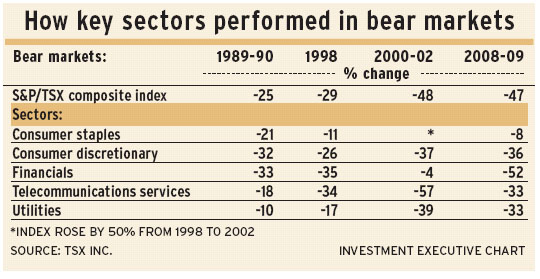
Recent bear markets may prove instructive in anticipating what may happen. Since 1988, there have been four significant market drops in which the S&P/TSX composite index lost 25% or more of its value:
– The 1989-90 bear market, with a 25% drop, was the inflection point upon which the high-tech boom accelerated to its climax in 2000.
– A 29% drop in 1998 turned out to be a false ending to the high-tech bull market.
– After the peak in 2000, the market dropped by 48% in two years.
– Most recently, the market dropped by 47% in 2008-09. The succeeding bull market has turned out to be unusually long-lived.
This study reaches back to 1988, meaning it’s not quite far back enough to include the stock market crash of 1987. The reason for this is that the current S&P/TSX composite index system has been calculated from yearend 1987 – although it was introduced in 2005. The indices use the global industry classification system (GICS), which has become the international standard. GICS divides all industries into 10 sectors.
Income stocks – such as utilities, telecommunications and consumer industries – by reputation resist bear markets most strongly. Their price volatility over the long term generally is low, resulting in many individual superior long-term investment returns. In fact, these stocks are not always the best to own when the market turns downward in a big way.
The long-term winner is consumer staples, which has risen at an average compound rate of 10% a year since 1987 vs the S&P/TSX composite’s 5.8% average annual compound growth rate. But despite consumer staples’ superior long-term growth, these stocks provided scant protection in the 1989-90 bear market, dropping by 21% vs the market’s 25% loss.
Then, in 1993-94, consumer staples suffered a 17% setback while the rest of the market moved sideways. That baseline launched a huge eight-year bull market for these stocks, as the sector’s index rose by six times to its 2002 high. In the dozen years since then, the sector has moved broadly sideways: the index dropped by 24% between 2005 and 2008 but then made a record high in October 2013.
Telecom stocks have risen at an average annual growth rate of 8.2% and also acted as “bear resisters” in 1989-90, as the sector’s index dropped by only 18% while the market as a whole dropped by 25%. But in 1998, telecoms lost more than the overall market’s 29% drop, falling by 34%. Telecoms didn’t do much better in the 2000-02 collapse, dropping by 57%. These stocks peaked almost a year before other sectors in the 2008-09 bear market, in which they dropped by 33% – much less than the overall market’s 47%.
Since then, the telecom sector has reached a new high, beating its 2000 peak. This recent breakout suggests telecoms may be strong relative to the market in the months and perhaps several years ahead.
Consumer discretionary stocks, much like consumer staples, closed 2013 at a record high. But the former provided no safety net in the 1989-90 bear market, dropping by 32%. They then fell by 26% in 1998 and, in the 2000-02 bear market, they dropped heavily (like most sectors), losing 37%. These stocks also dropped heavily in 2008-09, losing 36% of their value vs the overall market’s 47% drop.
In total, the consumer discretionary sector’s index ranks sixth among S&P/TSX sectors in 26-year growth, with an average annual growth rate of 6.6%.
The financial services sector – which has the largest market capitalization – declined by more than the S&P/TSX composite in the bear markets of 1989-90, 1998 (and financials continued to drop through most of 1999) and 2008-09. The great exception to this trend started from that 1999 low, when investors began to abandon high-tech stocks in favour of commodity and financial stocks.
The financial services sector climbed until peaking in 2007, a high it finally matched in October 2013; financials then closed 2013 at a record high. In the past 26 years, this sector rose by an average annual compound rate of 9.1%.
As long-term investments, utilities lag all other sectors. In the 26 years since yearend 1987, the utilities sector rose by a compound rate of 4.6% a year to yearend 2013.
Utilities were bear-resistant in the 1989-90 drop, dropping by 10% while the overall market lost 25%. It was different after that, however, as the 1998 bear market started a two-year, 43% drop for the utility sector’s index. As the overall market was peaking in 2000, utilities began an eight-year rise – in which the sector’s index tripled in value.
After dropping by 33% in 2008-09 vs the market’s 47% loss, utilities then regained their former highs. But in 2013, utilities dropped by 9% while the overall market rose by 10%.
© 2014 Investment Executive. All rights reserved.