BULL MARKETS HAVE LENGTHENED in duration in the past two decades while stock markets, in general, have become more volatile in the long term.
These conclusions are reached from the action taken on Wall Street. To repeat a market axiom, if you want to know what’s going to happen in the Canadian market, find out what Wall Street is doing and you will have your answer.
The current U.S. bull market – still alive as of early December – is 56 months old and counting. Its predecessor, from 2002 to 2007, lasted 60 months. Neither recent bull market matches the climax of the “supercycle” bull market that lasted from 1974 to 2000 and within which were several mini bull markets. The last one of those lasted for 10 years, from 1990 to 2000.
These measurements come from the S&P 500 composite index, the most widely used gauge of the U.S. stock market. This index dates back to the 1870s.
The current bull market has climbed by 166%, and its immediate 2002-07 predecessor gained by 102%. The 1990-2000 bull market rose by 411%.
Before 1990, bull markets were shorter. For instance, one lasted two years, from 1988 to 1990, while the previous one lasted three years, from 1984 to 1987.
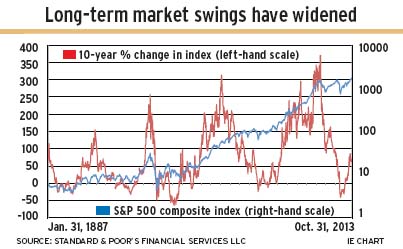
Another change in market behaviour should be noted: market swings have become wider since 2000. Bull-market highs have been higher since then, and bear-market lows have been lower.
Markets often display symmetry. If this occurs in the next bear market, a symmetrical low would be lower than both the 2009 low (677 on the index) and the 2002 low (777).
This trend of increasing volatility goes back to the 19th century. Cycles of improving long-term gains and drops recur. This reveals itself clearly in the 10-year change in S&P 500 composite index.
In 1887, the index showed a 116% gain over the preceding 10 years. In 1906, the 10-year gain was 155%. The 1929 bull market peaked at a 228% gain over the previous 10 years before the great market crash. In 1959, the capital gain was 314%. Finally, in 2000, the market had gained by 371% in 10 years.
The highest recent reading shows the market up by 87% in the 10 years ended February 2013.
On the negative side, mind you, there is no pattern. In 2009, the market had dropped by 41% in 10 years. The historical 1974 low recorded a 10-year drop of 25%. As the market crash of 1929 unwound, the market dropped by a maximum of 65% in the 10 years ended 1939.
Most recently, Wall Street recorded 10-year losses of as much as 41% in 2008-10.
Research conducted years ago by Hamilton E. Boulter, an analyst in Toronto who retired in 1979 after 50 years in the investment industry, established that a 10% price move by Canadian and U.S. indices is the threshold for changes in trend.
The exception is in resources markets, Boulter discovered, which have a 20% threshold of price change to indicate a new trend.
Boulter, research director of the long-defunct brokerage firm Draper Dobie & Co., discerned that index moves of less than 10% had no longer-term significance. However, a 10% change in direction was a warning if on the downside – and bullish on the upside.
Although there is no absolute signal for a bear market, a 20% drop is widely used as the signal nowadays.
In a bull market, there are usually several 10% reversals in direction, although there is no pattern. The 1990-2000 bull market climbed for seven years before dropping by 10%.
The current bull market has had three downward moves of 10% or more, with the 2011 drop stopping just shy of 20%. The latest 10% upward reversal started in June 2012, at the 1278 level.
© 2014 Investment Executive. All rights reserved.