
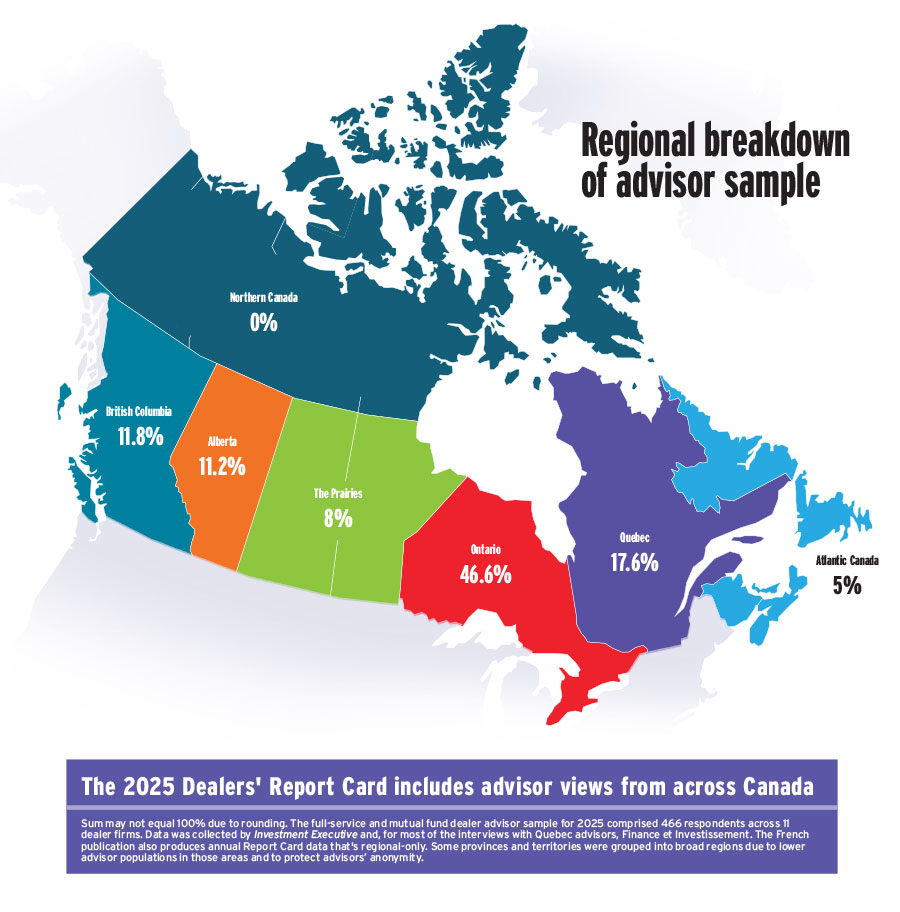
Research for the 2025 dealers’ Report Card by Investment Executive (IE) was conducted by seven research journalists: Sangjun (John) Han, Roland Inacay, Tiana Kirton, Diane Lalonde, Ciara Lalor-Lindo, Alisha Mughal and Sai Tamanna Sharma. These researchers spoke with 466 advisors across Canada from 11 mixed-dealer or mutual fund-only firms.
Data was predominantly collected via telephone interviews with the advisors, held between March 4 and May 2. All respondents were registered, full-time advisors who at minimum had their mutual fund licence; had worked with their firm for at least one year; and had worked in the industry for at least three years.
Advisor participants provided two ratings each for their firms’ support systems and services, across 25 categories: one rating for performance, considering how well their firm was helping them run their business and serve clients; and the other for importance, sharing how crucial each category or support area was to them personally. Both ratings were on a scale of zero to 10 — a rating of zero meant “very poor” or “unimportant,” while a rating of 10 signified “excellent” or “critically important.” Advisors were asked to provide ratings only for services and systems they had used directly.
For each firm, advisors’ ratings are aggregated into average results across the 25 categories. A significant change requires a year-over-year shift by half a point or more in a firm’s category rating. This also applies to: firms’ IE ratings, the average of all of a company’s category ratings; and the overall 2025 performance and importance averages (both are a tally of all the firms’ ratings by advisors in a given category). The performance average benchmarks firms’ individual ratings, while the importance average indicates how important the average dealer advisor feels a category is to their business and work.
Another metric used, the satisfaction gap or surplus, is defined as the difference between a category’s overall performance and importance averages. Where importance is higher and the average advisor wants more support, a satisfaction gap is identified.
The Report Card series isn’t an awards program or contest, and it isn’t a ranking exercise. It doesn’t base a firm’s or advisor’s inclusion or results on sales activity, revenue or assets. The project is editorial-driven research that aggregates opinion- and experience-based data, using a rigorous methodology.
Some category names in 2025 were edited for clarity, without affecting year-over-year comparisons. No categories were removed or added compared with the 2024 Report Card.
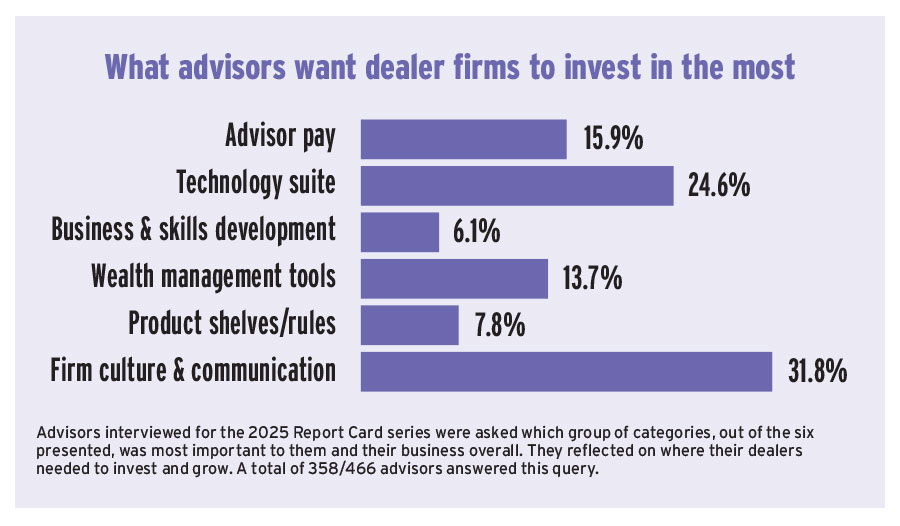
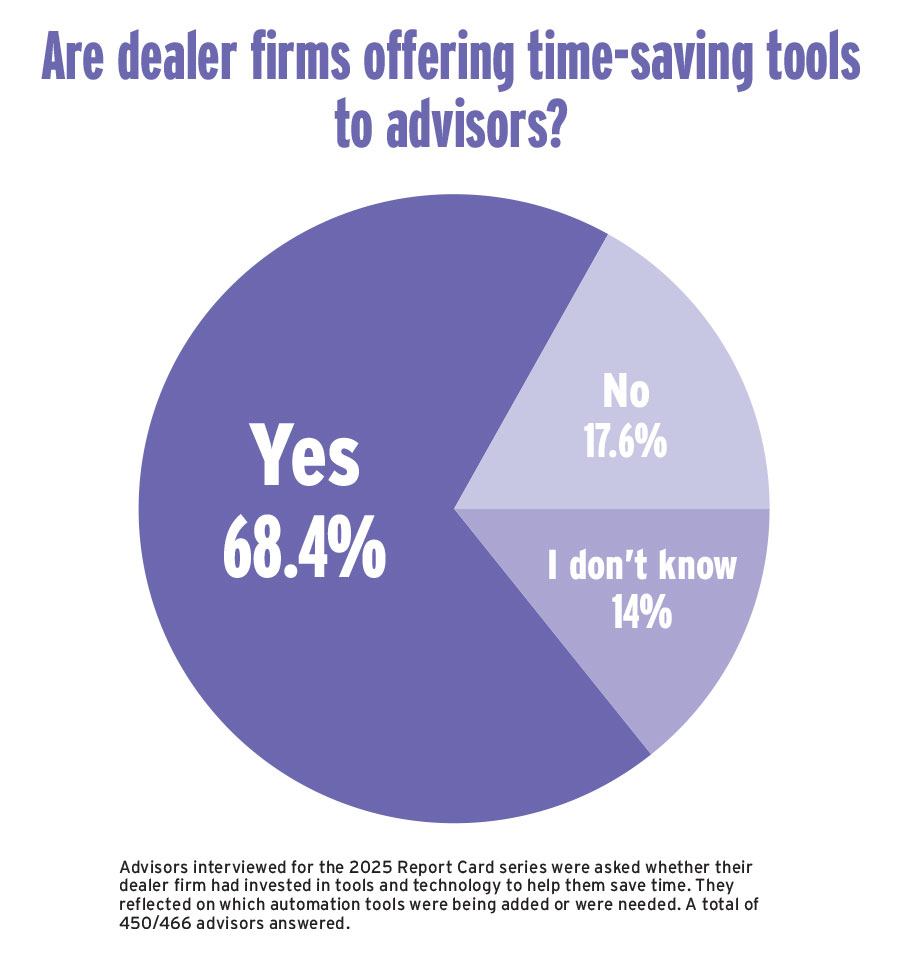
Advisors were also asked three supplemental questions, alongside confidential queries about their individual business details. The three questions were: 1) Of the six groups of categories included in the Report Card, which group or area was most important to them personally when it came to their business and firm relationship (see bar chart, below); 2) Whether their firm had, within the past year, invested in tools or technology to help them save time by automating repetitive everyday tasks (see pie chart, below); and 3) Whether they worked with and/or mentored, or were themselves, newer advisors (advisors who had 10 years of industry experience or less, who were still building their businesses).
Click image for full-size chart
Click image for full-size chart
Click image for full-size chart
This article appears in the September 2025 issue of Investment Executive. Subscribe to the print edition, read the digital edition or read the articles online.