
Heading into this year, the mixed dealer and mutual-fund-only advisor segment continued to thrive — with professionals in the space reporting solid asset growth and stronger productivity by the end of 2024.
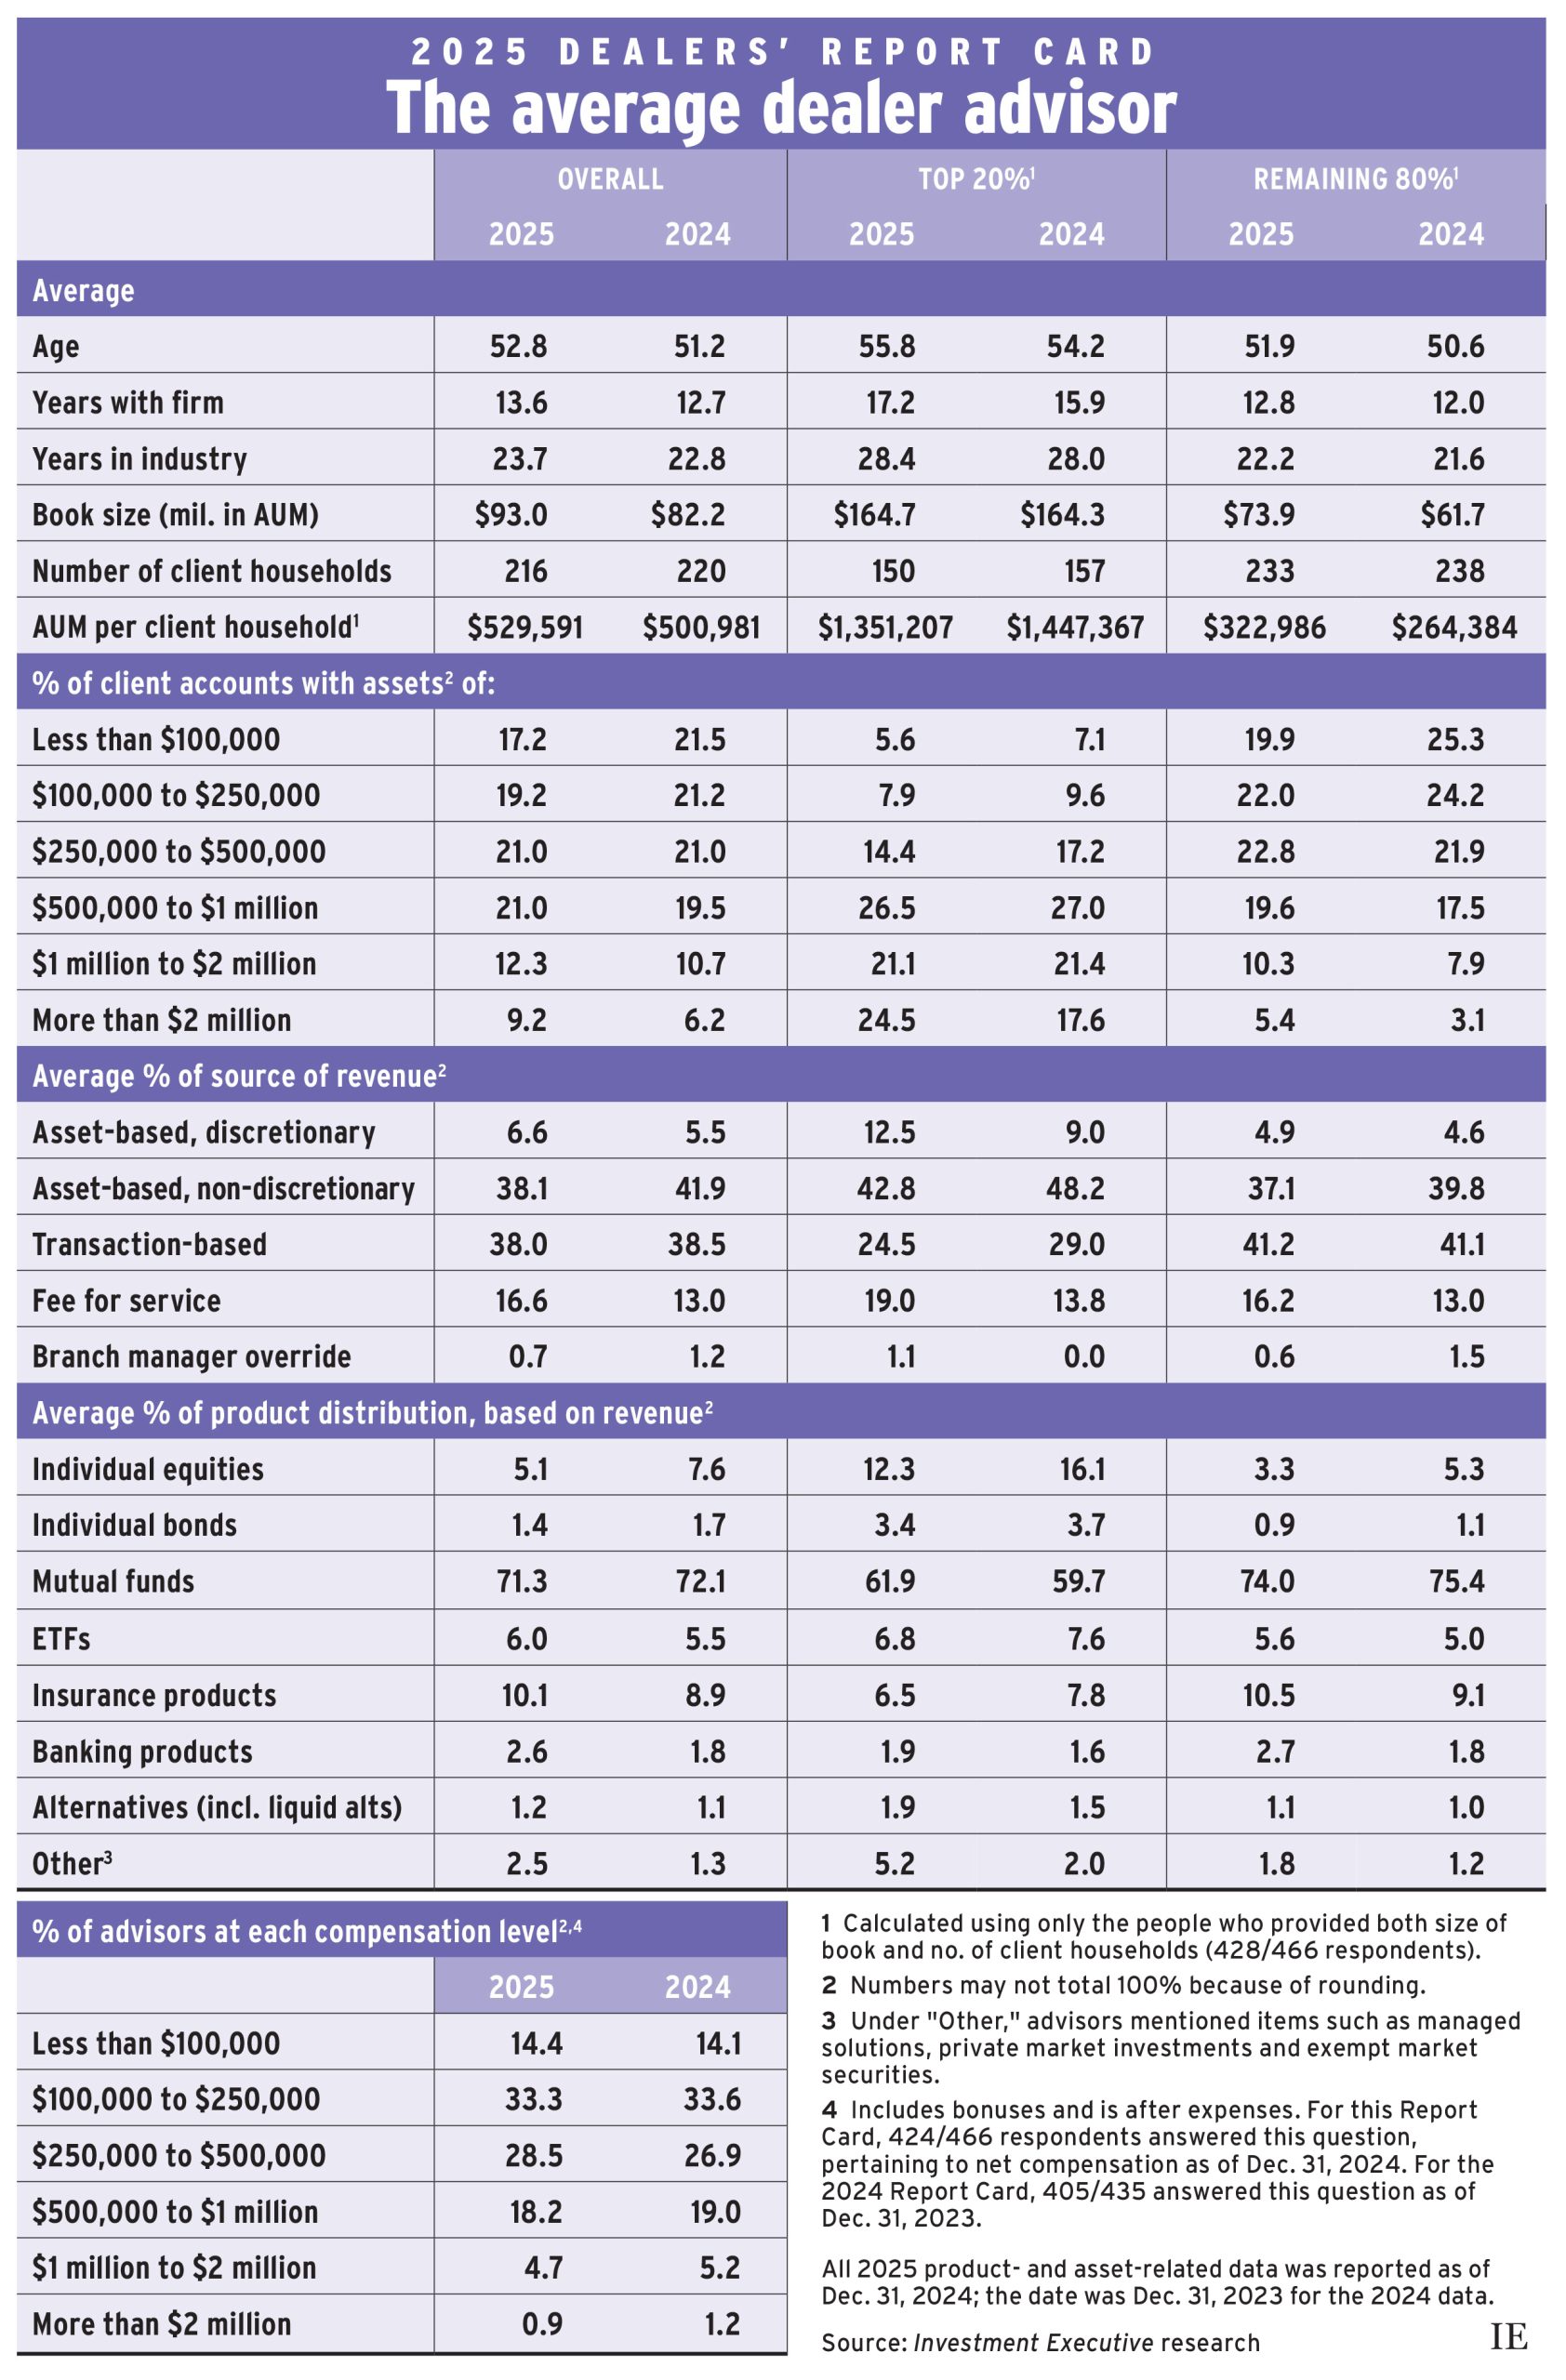
The average advisor in the latest edition of Investment Executive’s Dealers’ Report Card reported double-digit growth in their assets under management (AUM), with average assets coming in at $93 million at the close of 2024, up from $82.2 million in the previous report that was based on the close of business for 2023.
This growth came amid relative stability in client numbers over the same period, with the average dealer advisor serving 216 client households, down slightly from 220 households in last year’s research. Paired with their robust growth in assets, the average advisor saw improved productivity — defined as AUM per client household — coming into 2025.
The average advisor’s productivity result in our latest report rose to almost $530,000. That compared with just over $500,000 in last year’s research.
The industry’s best performers — defined as the top 20% of advisors and measured by AUM per client — saw little growth between late 2023 and 2024.
The average top performer reported $164.7 million in AUM, essentially unchanged from $164.3 million in last year’s report. Their client numbers fell from an average of 157 to 150.
The group’s average productivity was down, too, to $1.35 million from roughly $1.45 million in last year’s report. That decline came with an important caveat, however — two of the top advisors in our 2024 report had an outsized effect on average AUM per client in last year’s data set.
Looking back instead at the 2023 report, which used year-end 2022 as a benchmark, shows that our productivity metric among the top 20% of advisors was up about 5% (as of Dec. 31, 2024 and the most recent report) from $1.29 million two years ago.
Part of that growth was advisors in the top 20% group having increased their exposure to wealthy clients. The average top performer reported in this recent data that nearly a quarter of their book (24.5%) was allocated to client households worth more than $2 million. That was up significantly from 17.6% in last year’s research.
At the same time, the top performers’ allocations to every other client asset category declined — most noticeably below the $500,000 mark — perhaps showing that clients with half a million dollars or less in investable assets were finding it more difficult to attract top advisors or meet minimum thresholds. Their share of top-performing advisor books was down to 27.9% from 33.9% year over year.
The same was true among the other 80% of dealer advisors, albeit to a lesser degree. Accounts worth $500,000 or less made up 64.7% of their average books, still a majority but down from a year ago. Clients with at least $1 million in assets made up 15.7% of these advisors’ books on average, up from 11%.
Average AUM for the remaining 80% of advisors rose almost 20% to $73.9 million. Client numbers remained relatively flat at 233. On the strength of their gain in assets, their average productivity jumped more than 20% to $322,986 in this year’s report.
Revenue mix
The composition of dealer advisors’ reported revenue sources has also evolved. Most notably, the share of revenue generated from fee-for-service business was up to 16.6% this year from 13%.
That trend was evident across the data set. The top performers saw their share of this type of revenue rise to 19% from 13.8%. The remaining advisors reported an average fee-for-service allocation of 16.2%, up from 13%.
Among all advisors, transaction-based revenue fell 50 basis points to 38%. And there was an even bigger erosion in advisors’ use of non-discretionary asset-based fees, which declined to 38.1% of revenue from 41.9% in last year’s report.
While that decline likely fed some growth in fee-for-service business, advisors’ dependence on discretionary asset-based fees also rose, edging up to 6.6% from 5.5%.
These trends were particularly evident among the industry’s top-performing group.
Their average share of revenue from transaction-based business was down to 24.5% from 29%. The top 20% group’s share of revenue from non-discretionary asset-based fees also dropped notably, to 42.8% in this year’s report from 48.2%.
And, while the top-performing advisors saw growth in their average fee-for-service business, they also ramped up reliance on discretionary asset-based fees, to 12.5% of their revenue from just 9% in last year’s report.
This increased reliance among top advisors on both discretionary asset-based fees and fee-for-service work may point to a growing reliance on their ability to offer boutique, high-end services.
Given that advisors and investors alike are now grappling with macroeconomic instability and extreme policy uncertainty, an advisor’s ability to set themselves apart and offer expert advice is proving more valuable than ever.
Click image for full-size chart
This article appears in the September 2025 issue of Investment Executive. Subscribe to the print edition, read the digital edition or read the articles online.