
The Advisors’ Report Card is a summation of Investment Executive’s (IE) three 2025 Report Cards. Between Jan. 8 and June 20, IE interviewed 1,424 financial advisors and planners across 31 businesses in conducting this year’s Brokerage Report Card, Dealers’ Report Card and Report Card on Banks. These reports were published in June, September and October.
To participate, advisor respondents must have worked with the firms or banks they were rating for at least one year. They must also have worked in the industry for at least three years, among other licensing and channel-specific requirements.
The interviews were conducted by seven research journalists: Sangjun (John) Han, Roland Inacay, Tiana Kirton, Diane Lalonde, Ciara Lalor-Lindo, Alisha Mughal and Sai Tamanna Sharma. They asked advisors and planners to provide a performance and importance rating for each of the categories used to assess the support systems at their firms or banks. The ratings ranged between zero (meaning “poor” or “unimportant”) and 10 (meaning “excellent” or “critically important”). Advisors also were asked to share how likely they would be to recommend their firms or banks as a workplace.
The Advisors’ Report Card examines the 26 categories relevant to the three industry channels in the research series, with a few exceptions. Four areas aren’t applicable for the advisors and planners working within the Big Six banks’ retail divisions, covered in the Report Card on Banks. One category, “bonus structure,” isn’t used in the Dealers’ Report Card.
This year’s categories match those used in 2024. Some category names have been edited for clarity or relevance, but their year-over-year comparability was not affected.
For each industry channel, advisors’ and planners’ ratings have been aggregated into average results across the 26 areas. A significant change requires a year-over-year shift by half a point or more in a channel’s category rating. This also applies to the collective 2025 performance and importance averages. The collective performance average benchmarks each channel’s individual averages, while the collective importance average indicates how important a category was to the average advisor’s work.
Another metric used, the satisfaction gap or surplus, is defined as the difference between a category’s overall performance and importance averages. Where importance is higher and the average advisor wanted more support, a satisfaction gap is identified.
The Report Card series isn’t an awards program or contest, and it isn’t a ranking exercise. The project is editorial-driven research that aggregates opinion- and experience-based data, using a rigorous methodology.
Two supplemental questions were posed to advisors in all channels: 1) Of the six groups of categories included in the Report Card survey, which subgroup or type of support is most important to you and your business? (i.e., what should your firm focus on the most?); and 2) Within the past year, has your firm or bank invested in more tools or technology to help you save time by automating repetitive everyday tasks?
The Brokerage and Dealers’ advisors were asked an additional question that’s relevant to the summary report’s themes: Do you work with and/or mentor a newer, emerging advisor, or are you one yourself (defined as an advisor with 10 years of experience or less, who’s still building their business)?
The main table, downloadable with an email address, details the data collected for each industry channel in this year’s research.
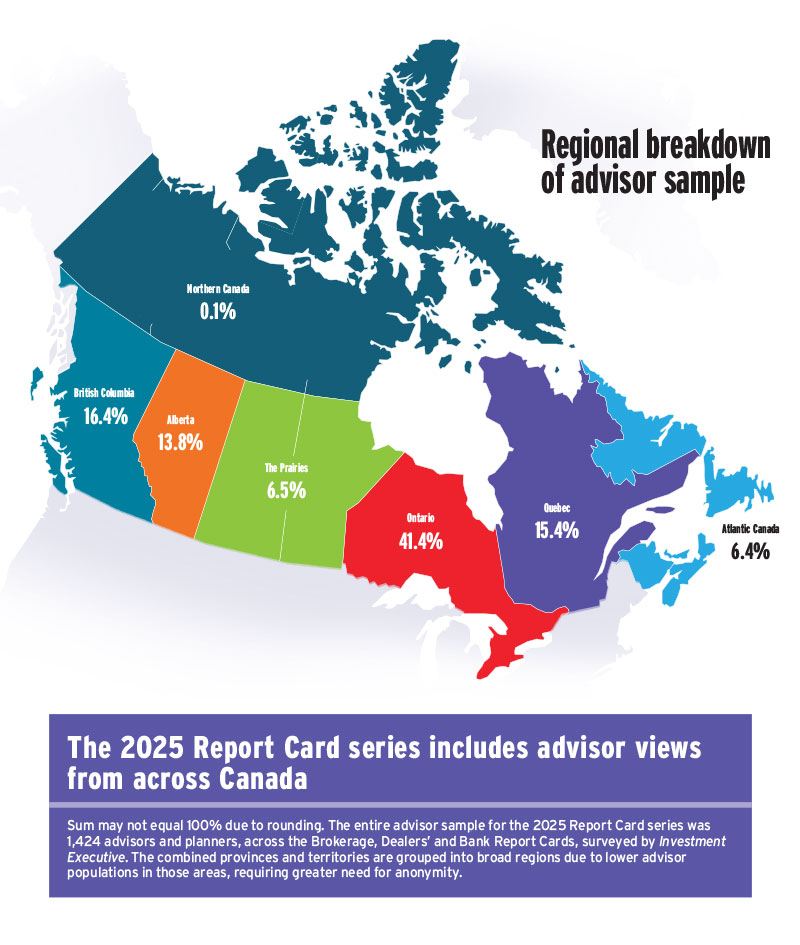
Click image for full-size map.
This article appears in the November 2025 issue of Investment Executive. Read the digital edition or read the articles online.