In recent years, the stock market has discovered that the most stable stocks – or the least volatile – produce the best long-term results.
There is an added benefit. In the short term, when stock prices drop sharply, low-volatility stocks also resist the downtrend most strongly.
Since the stock markets in Canada and the U.S. started dropping sharply in August, the most stable of the largest stocks have, as a group, dropped by less than their more volatile comrades.
Performance of stocks in the S&P/TSX 60 index indicates this. This index is the Canadian counterpart to the S&P 500 composite index in the U.S. – Wall Street’s most used measure of stock market performance.
Price stability in Canada is measured over 10 years, which eliminates some stocks in the S&P/TSX 60 index for consideration. Thus, such stocks as ARC Resources Ltd., Cenovus Energy Inc., Constellation Software Inc., Franco-Nevada Corp. and Restaurant Brands International Inc. are excluded.
The prices of the 19 most stable stocks in the S&P/TSX 60 index dropped by an average of 16% from their 52-week highs to late September. The remaining stocks in the S&P/TSX 60 index (excluding the five issues that have traded for less than 10 years) have dropped by an average of 37%.
There is a wide range in performance among the most stable members of the S&P/TSX 60 index. The largest loser has been Pembina Pipeline Corp., down by 34%. At the other end of the spectrum is Rogers Communications Inc.’s Class B shares, which have dropped by only 2%.
Pembina’s loss is the strongest indicator of price drops in the energy sector. The two stocks with the most stable 10-year ratings are from that sector. Enbridge Inc. is down by 23% and TransCanada Corp. has dropped by 29%.
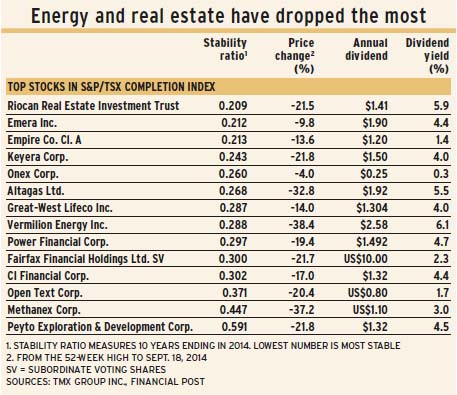
A similar pattern exists among the 20 largest issues in the S&P/TSX completion index – essentially, a mid-cap index. (See table above.) Only 14 of these stocks have 10-year price histories. The nine most stable have dropped by an average of 20%, while the remainder averaged a 24% drop.
The biggest losers are all in the energy or real estate sector.
Price stability is a function of size: large-cap stocks are, as a group, more stable than small-cap stocks.
Stability – or its opposite, volatility – can be measured many ways. Beta is most common. Beta’s weakness is linkage to a stock index. It also is usually calculated for short-term periods.
Other formulas for calculating stability/volatility measure a stock’s performance individually, unrelated to other stocks or indices. One such method is the standard deviation of total returns. New York-based Value Line Investment Survey has a proprietary method of determining long-term price stability. But the original Value Line stability measurement is the drop to date from the 52-week high; it employs simple arithmetic and takes into account the influence a secular price trend has on apparent volatility.
Over short-term periods, the so-called “price volatility ratio” may be useful. It calculates the ratio between average high prices and average low prices. For example, in the past five years, Pembina’s average high price has been 1.4 times its average low price, and Rogers Communications’ average high price has been 1.3 times its average low price.
There are wider extremes. For example, BlackBerry Inc.’s five-year average high price has been 2.7 times its average low price, while Saputo Inc.’s average high price has been only 1.1 times its average low price.
© 2015 Investment Executive. All rights reserved.