There’s a disconnection between business results, which are poorer, and the stock market, which keeps rising.
This is unusual. The stock market usually rises in advance of a business expansion. The disconnection indicates suspicion about the stock market’s valuation of businesses. Mind you, this contradiction could end at any time.
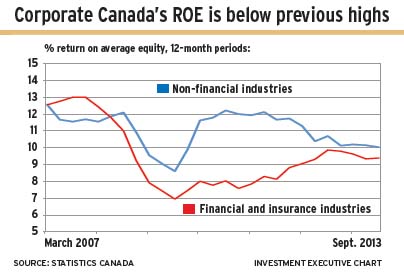
In terms of profitability, non-financial businesses in Canada have not recovered from the Great Recession of 2008-09. The peak return on equity (ROE) for these sectors was reached in 2006. And peak ROE for the financial services sector – the other half of corporate Canada – occurred in 2007. Net income in both halves of Canada’s economy has flattened in the past year.
Investment Executive‘s measurements come from analysis of Statistics Canada’s (StatsCan) Quarterly Financial Statistics for Enterprises report. Moving 12-month periods are compared.
The data show that the ROE for non-financial businesses dropped to 10% in the 12 months ended Sept. 30, 2013 (the latest available data) from 14% in 2006.
Financial services sector ROE peaked at 13% in the 12 months ended Sept. 30, 2007 and dropped to 9% in the 12 months ended Sept. 30, 2013. Return on average assets, another important indicator for this sector, also has dropped – to 1.3% in the latest 12-month period vs a high of 1.8% in 2007 and 2% in 2000.
For non-financial businesses, net income dropped by 2% in the 12 months ended Sept. 30, 2013, vs the corresponding period a year prior. In the financial services sector, net income edged up by 2% year-over-year. Meanwhile, the S&P/TSX composite index rose by almost 4% during this time – and it has risen higher since last September.
Since the 12 months ended March 31, 2009, net income for both halves of Canada’s economy has increased by 31%. In the same period, the S&P/TSX composite index rose by 47%.
Corporate Canada’s revenue has grown, but has not yet reached the pre-recessionary high rates of growth. In fact, year-over-year gains have been getting weaker. Non-financial businesses’ top line increased by 1.3% in the 12 months ended Sept. 30, 2013, vs the corresponding period a year prior. In the 12 months ended Dec. 31, 2011, growth in operating revenue reached a post-recessionary high rate of 8.6%.
Operating revenue in the financial services sector actually dropped by 0.4% year-over-year in the 12 months ended Sept. 30, 2013. The post-recession peak growth of 6.8% was reached in the 12 months ended Dec. 31, 2011.
Businesses also have been squeezing less out of their assets. In the 12 months ended Sept. 30, 2006, non-financial business sales were 1.1 times assets. The turnover ratio dropped to 0.8 times in the latest 12-month period.
There is a similar pattern in the financial services sector – although assets are far greater in proportion to operating revenue. The key difference is that the financial services sector’s turnover ratio has been dropping for 12 years, due to lower interest rates.
However, corporate Canada’s balance sheet has strengthened; dependence on debt has been cut. For non-financial businesses, equity equalled 42% of assets in the latest 12-month period – the highest level since 2000. But it’s a different picture in the financial services sector. Equity equalled 14% of assets in the latest period – well below the 29% seen in 2000.
A change that must be noted is that non-financial businesses have been reinvesting more of their earnings. Retained earnings were 29% of equity on March 31, 2011, but rose to 36% on Sept. 30, 2013.
The trend has gone the other way in the financial services sector, in which retained earnings equalled 58% of equity in Dec. 31, 2011, but had dropped to 49% by Sept. 30, 2013.
Capital spending in non-financial businesses dropped in 2013. Between the 12 months ended June 30, 2008, and the 12 months ended Dec. 31, 2012, capital expenditures rose by 534%, then dropped by 10% since.
Manufacturing is an exception. That sector’s growth spurt in capital expenditures started in 2006 and reached a new high in the latest 12-month period, gaining 12% since June 30, 2006.
© 2014 Investment Executive. All rights reserved.