It has taken five years, but the businesses of financial advisors in the brokerage sector finally have recovered all the ground they lost to the financial crisis. Now, instead of just recovering those lost assets under management (AUM), these advisors are beginning to grow them once again.
The road back from the financial crisis has been long and slow. The economic rebound has been relatively weak; and, although the rebound has been fuelled by unprecedented monetary stimulus, it also has been disrupted repeatedly by the assorted fiscal crises in both the U.S. and Europe. Only now are stock markets finally recovering to, and surpassing, their pre-crisis levels.
With that recovery in the markets, advisors finally are seeing their businesses return to their pre-crisis levels. The latest edition of Investment Executive‘s (IE) Brokerage Report Card finds that the average advisor now has rebuilt his or her book fully and is starting to see some fresh growth for the first time in years.
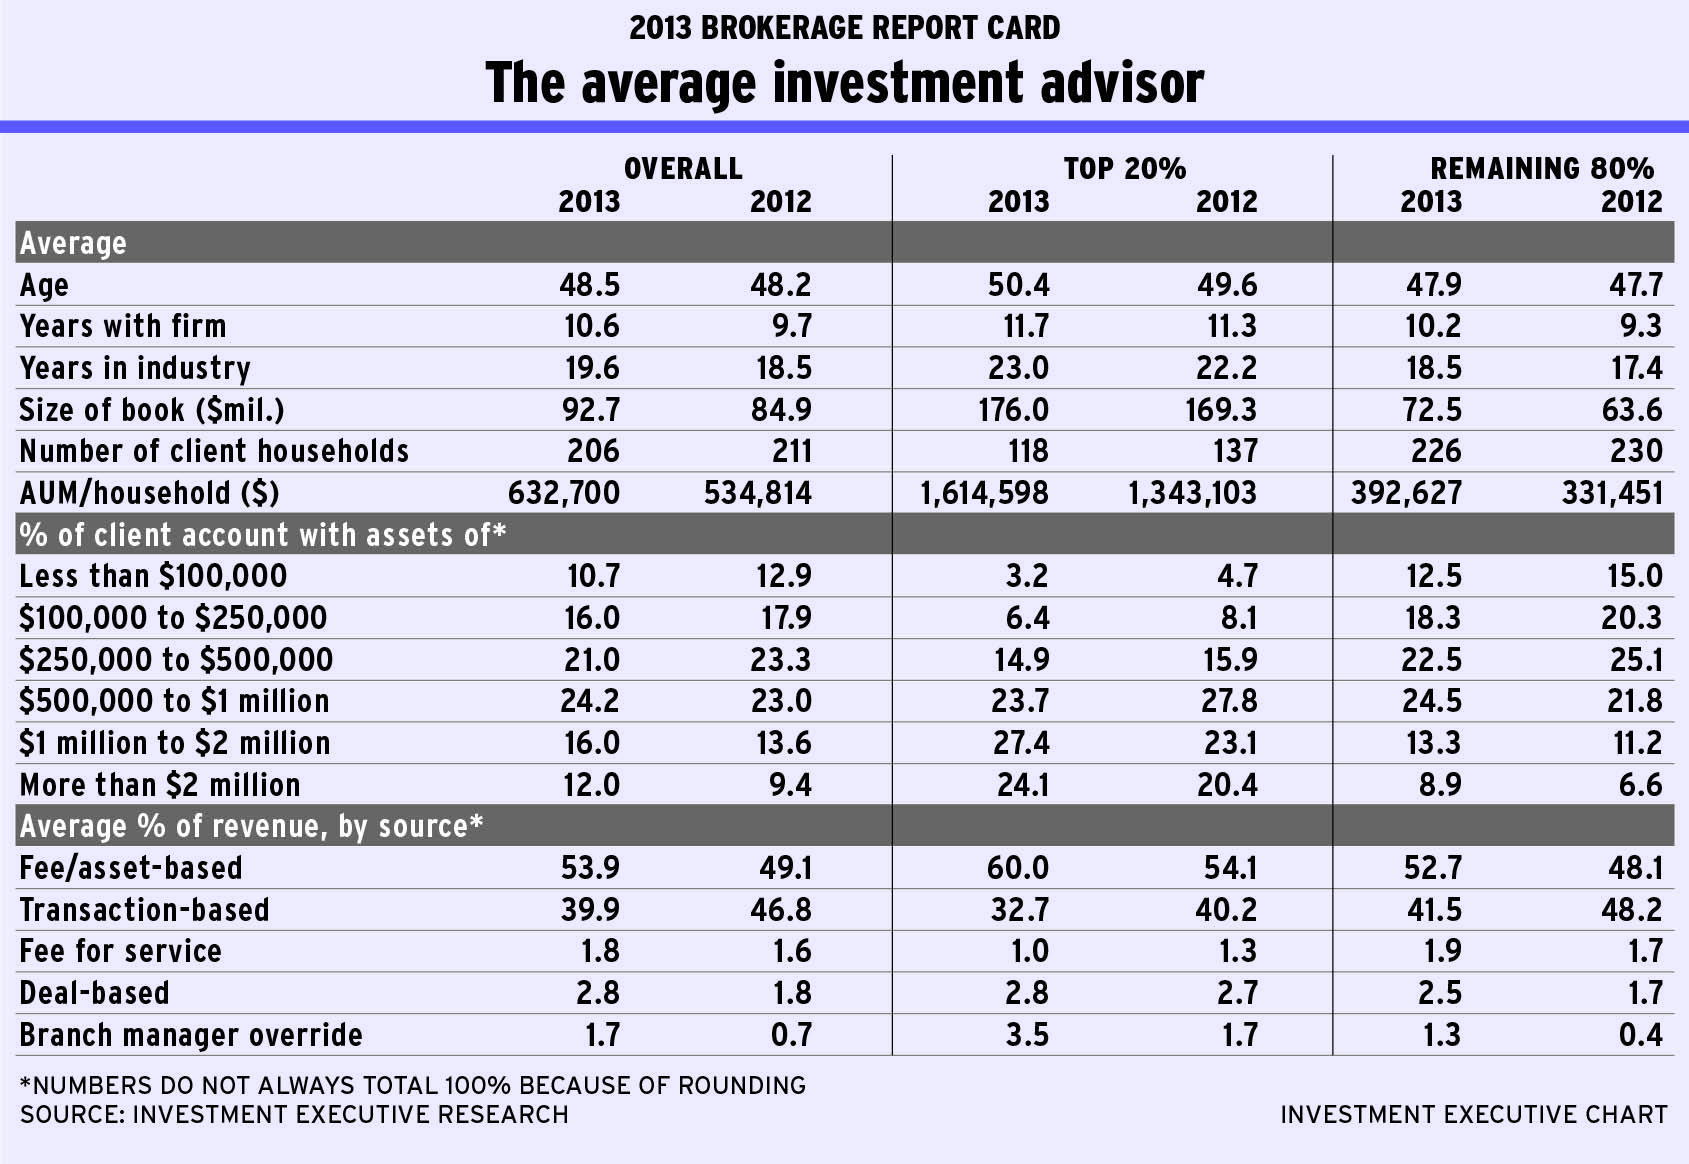
In the spring of 2008, the average advisor had about $86 million in AUM. Immediately after the crisis hit in late 2008, the advisors surveyed for IE‘s 2009 Brokerage Report Card saw their average AUM plunge to about $70 million. Although advisors in this sector of the financial services industry have reported steady growth in average AUM since then, this is the first year AUM finally surpassed the levels attained before the crisis. Now, average AUM is almost $93 million.
Moreover, the number of client households the average advisor serves is now slightly lower than in pre-crisis days (206 client households today compared with 212 households in 2008). In the immediate aftermath of the crisis, with brokers in desperate asset-retention mode, the average number of client households served rose as advisors scrambled to add clients and keep their asset bases from eroding further.
Now, advisors are narrowing their focus once again, with many choosing to prioritize their wealthier clients. This process is taking place throughout the brokerage sector – among both the top-producing advisors and the remainder of the advisory sales force.
(IE segments the sector into the top 20% of advisors – the top producers, as measured by AUM/client household – and the remaining 80% of advisors to delve deeper into emerging trends.)
Looking at both segments of the advisory sales force, it’s clear that both top producers and the rest of the sector are growing their AUM and trimming their client rosters. However, perhaps somewhat surprising, this analysis also reveals that it’s not the sector’s top-producing advisors that are driving the renewed growth; rather, the impetus primarily is from the remaining 80% of advisors.
In fact, although the top 20% of advisors have added AUM over the past year, with average AUM rising to $176 million from $169.3 million in 2012, this puts those advisors back to only pre-crisis levels. It’s the rest of the sector that is seeing fresh growth. For the remaining 80% of advisors, average AUM is up to $72.5 million this year – well above the $63.8 million they had in 2008.
The lower-producing 80% of advisors had basically returned to 2008 AUM levels in last year’s Report Card. So, the impressive growth they have managed in the past year – with average AUM increasing from $63.6 million in 2012 – not only outpaces the top producers on both a nominal and a percentage basis, it also represents new AUM, not just ongoing balance-sheet repair.
This new growth is impressive, in that it comes amid a modest trimming in the number of households served, which indicates that the remaining 80% of advisors are not powering their AUM accumulation with the addition of new clients. Rather, their average client roster is down to 226 client households this year from 230 households last year. As a result, their average AUM/client household is now up to $392,627 vs $331,451 last year.
This combination of impressive AUM growth and lower client numbers among the remaining 80% of advisors implies that they have done a superior job of focusing on their most valuable clients and are successfully consolidating their assets.
The top 20% of advisors also have increased their productivity, with AUM/client household rising to $1.6 million from $1.3 million last year; however, that has come largely through the cutting of client numbers, with the average book size for top performers down to 118 this year from about 137 in 2012. Furthermore, these improvements only put these advisors back to the level of their 2008 metrics.
The success that advisors on both sides of the production divide have had in intensifying their focus on their more valuable clients also is evident in the shifts taking place in the account distribution data. Looking at the overall advisor population, there has been a shift toward larger accounts, with $500,000 as the demarcation point – allocations to all account categories worth less than $500,000 have dropped, and allocations to accounts of more than that amount have increased.
Last year, 54.1% of all accounts fell into categories worth less than $500,000. This year, that has dropped to 47.7%. Moreover, the largest account category in 2012 was the $250,000-$500,000 category, which claimed 23.3% of the average advisor’s book. This year, the $500,000-$1 million range is the largest category in the average book, with a 24.2% share.
And there also are handsome increases in the allocations to accounts of more than $1 million. This year, the average advisor reports that 28% of his or her accounts are worth more than $1 million, including 12% that are larger than $2 million. Last year, just 23% of the average advisor’s book was in accounts of more than $1 million, with 9.4% in accounts greater than $2 million.
For the top 20% of advisors, 24.5% of their books is now in accounts smaller than $500,000; and accounts worth less than $250,000 make up 9.6% of their books. For these top producers, the $1 million-$2 million category is now the largest portion of their book, at 27.4%, and accounts larger than $2 million are a close second, representing 24.1% of their books.
A similar shift is taking place among the remaining 80% of advisors, albeit at lower AUM levels. For these brokers, accounts in the $500,000-$1 million range now comprise the largest segment of their books, at 24.5%, up from 21.8% last year. And these advisors also have seen a jump in their largest accounts, with accounts worth more than $1 million now making up 22.2% of the average book, up from 17.8% last year.
Accompanying this clear migration toward higher-value accounts is the continued shift toward a greater reliance on fee- and asset-based revenue and away from transactions. For the brokerage sector overall, the average advisor now reports generating 53.9% of his or her revenue from fee- and asset-based sources, up from 49.1% last year. At the same time, transaction-driven revenue has slumped to 39.9% of the average advisor’s top line, down from 46.8% last year.
As usual, it’s the top producers who are leading the shift toward fee- and asset-based sources of revenue. They now report that 60% of their revenue comes from fee- and asset-based sources, up from 54.1% a year ago.
The rest of the sector also is now more reliant on fees, which represent 52.7% of revenue vs transactions accounting for 41.5%. This represents a dramatic swing from last year, when revenue for this advisor segment was essentially evenly split between transaction-based sources and fee- and asset-based sources.
The logical result of these trends toward larger books, the increased focus on wealthier clients and higher productivity is higher compensation. This year’s Report Card confirms that, revealing that 33.5% of advisors overall are earning between $250,000 and $500,000, making this the single largest compensation category. In last year’s survey, the most populous category was the $100,000-$250,000 range.
One of the key factors underlying many of these trends is the resurgence in equities markets, particularly the recent recovery in U.S. markets, which have seen indices edging into record territory. Although domestic markets have been on the weaker side for the past couple of years compared with the U.S., the revival of the world’s most important equities markets clearly has had an encouraging effect on the Canadian advisory business – and this is reflected in the asset-allocation data.
The average advisor now has 39.8% of his or her book in equities, up from 36.1% last year. At the same time, the percentage of bond and mutual fund allocations both have dropped.
Interestingly, exchange-traded fund allocations are essentially unchanged at 5.4%, whereas allocations to pricier managed products (both proprietary and third-party) are up – trends that signal a surprising lack of cost sensitivity among clients despite the prevailing low-return environment.
Allocations to banking products also increased year-over-year to 3.5% from 2.6%. And the mix of bank product revenue has shifted dramatically away from guaranteed investment certificates (GICs) – although GICs still remain the dominant bank product, with 59.7% share of revenue – and toward high-interest savings accounts (HISAs), which jumped to 29.7% of banking revenue this year from 9% last year.
This trend suggests that this is money likely to be deployed sooner rather than later and that clients are reluctant to lock it in – perhaps anticipating an imminent move into longer-term assets.
Although the overall market outlook remains somewhat uncertain, it’s clear its recent resurgence has given a shot in the arm to Canada’s advisors in the brokerage channel.
© 2013 Investment Executive. All rights reserved.