
PAID CONTENT
In today’s environment, asset managers are navigating seismic shifts in public market dynamics that tend to emerge every five years or so. The recent downturn in equities has led some professionals to reassess their public market exposure and explore alternative strategies to mitigate portfolio volatility. While there’s no universal solution to this challenge, there are straightforward and effective ways to enhance portfolio composition by incorporating private assets.
Unstable politics and overpriced stocks: A risky combination
With Donald Trump’s ascent to the Oval Office, public markets were destined for heightened volatility. The threat of tariffs against key trading partners was guaranteed to disrupt markets, marking a historical shift away from a global free-trade model. Additionally, profound planned cuts in U.S. government spending serve to increase risks to the broader economy and employment. Some analysts estimate that layoffs associated with the Department of Government Efficiency (DOGE) could reach 1 million[1], or nearly 20 percent of the U.S. public workforce. The historic realignment of the public workforce, coupled with significant government spending cuts by itself could push the economy into recession.
In combination with frothy equity markets[2] fueled by persistently high expectations, normalcy bias, and a relentless passive bid via the ETF-ization of financial markets, a fierce downdraft was inevitable.
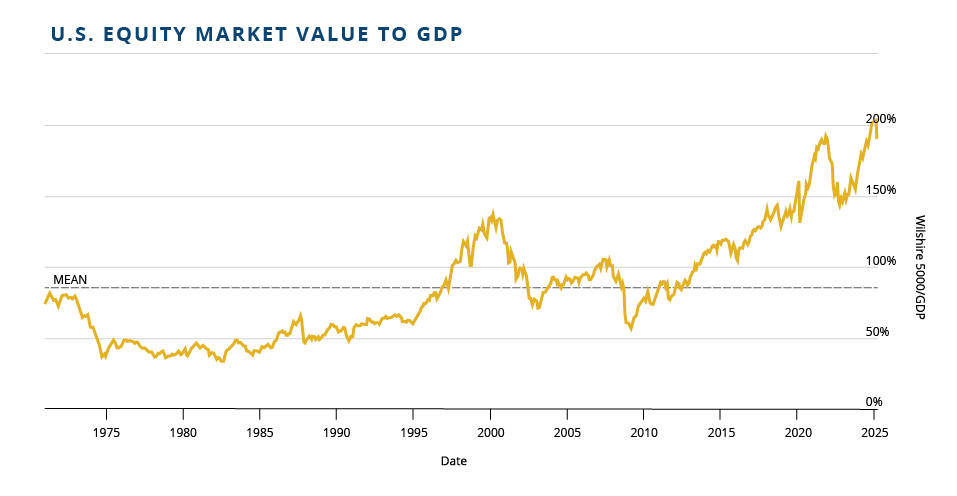
According to the well-observed Buffett Indicator[3]—a metric that compares the total market capitalization of a country’s publicly traded stocks to its gross domestic product (GDP)—the market cap to GDP ratio is 187.6% (as of March 31, 2025). At these levels, the indicator implies that U.S. equities remain significantly overvalued despite the recent correction.
Historically, the S&P 500 and S&P/TSX Composite indices have exhibited a correlation of approximately 80%.[4] Although managing to buck the trend for the quarter, Canadian equity markets have largely mirrored U.S. market volatility amid ongoing trade tensions and general economic uncertainty.
As of March 31, 2025, the SP/TSX Composite index rose 0.76% year-to-day versus a decline of 4.59% and 10.41% for the S&P 500 and NASDAQ 100, respectively.
Mitigating portfolio risk through private asset allocation
While equities attract most investor attention due to dominant news coverage and their easily measurable price movements, private assets, when used strategically, can help mitigate public market risk. With mark-to-model valuation methods, volatility can be largely eliminated, as unit value changes are not impacted by weekly market fluctuations. Private Real Estate Investment Trust (REIT) and alternative asset portfolios are typically valued solely through data-driven calculations backed by certified appraisals.
Given these advantages and more, private assets are capturing a record share of investor portfolio allocations.
According to Barclays annual report[5], family offices and wealthy individuals are showing increasing interest in private markets. Among the eight distinct benefits cited by its Industry insight segment authors, access to opportunities, diversification and return potential stand out to us as the most prominent.
Regarding the latter, the authors state that “over the long term, private markets have demonstrated an ability to outperform public market equivalents.” The authors further opine that “the average family office portfolio allocation to private market investments is around 45%,” which they see “increasing over time.”
Private REITs and renewable infrastructure funds, such as those offered by Skyline, may be suitable options for asset allocators seeking exposure to private market investments.
Private Assets: Outperformance and stability are possible
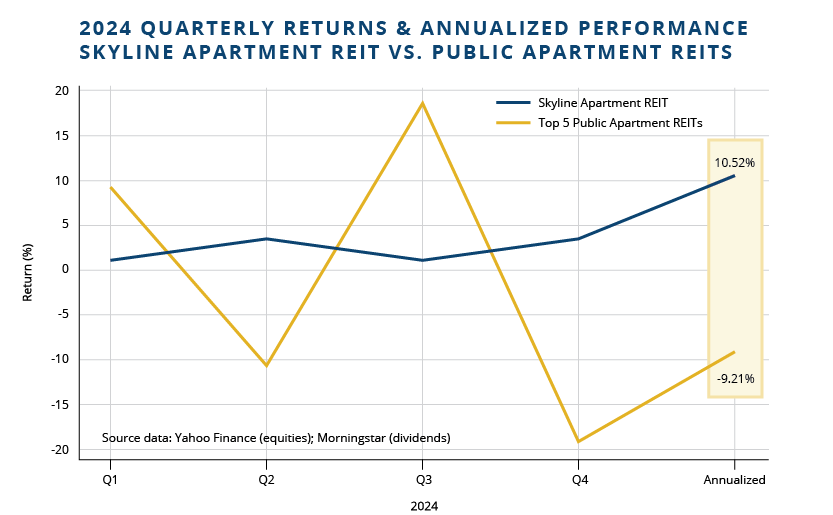
Skyline’s REITs and Clean Energy Fund have a strong performance track record, and 2024 was no exception. Skyline Apartment REIT, our largest trust by portfolio fair value, significantly outperformed its public market peers in 2024—a comparison that underscores the trust’s resilience and ability to excel in volatile conditions.
For the year, Skyline Apartment REIT Class ‘F’ units produced a net 10.61% annualized return (6.31% net value increase, 3.86% distribution yield + DRIP; Class ‘A’ since inception: 13.81%), while the five largest publicly traded Apartment REITs by market capitalization produced an average (non-market cap weighted) return on -9.21%. That’s a difference of almost 20 percentage points. If we factor out one-time special distributions from two of the five companies, our performance would exceed all Class units by over 21 percentage points. This is especially notable given this outperformance occurred in a year when the Toronto Stock Exchange gained 17.98%.
With another double-digit return in 2024 and an historically stable long-term performance profile, we continue to demonstrate that private assets can generate consistent results while remaining largely insulated from public market volatility. In fact, Skyline Apartment REIT has not had a unit value decline in almost two decades since inception in 2006. Our investment products have become a valuable addition to many diversified portfolios, offering asset allocators an effective way to mitigate risk without sacrificing performance.
![]()
About Skyline Wealth Management
Skyline Wealth Management Inc. (“Skyline Wealth Management”) connects portfolio managers and institutional investors to several private alternative investments operating in the Canadian real estate and clean energy sectors and totaling over $9 billion in assets under management (as at December 31, 2024). These private alternative investments are:
- Skyline Apartment REIT (Fundserv code: SKY2006)
- Skyline Industrial REIT (Fundserv code: SKY2012)
- Skyline Retail REIT (Fundserv code: SKY2013)
- Skyline Clean Energy Fund (Fundserv code: SKY2018)
Each investment comprises a portfolio of geographically diverse assets, offering clients strong historical performance and stable distribution, low MERs, and potential diversification solutions with lower relative volatility to the public markets.
Visit SkylineWealthManagement.ca for more information.

Wayne Byrd, CPA, CMA
Chief Financial Officer, Skyline
[1] DOGE Layoffs Pose ‘Growing’ Risk To U.S. Economy And Markets, Says Apollo Economist, DOGE Layoffs Bring ‘Growing’ Risk To Economy And Markets, Economist Says, February 24, 2025
[2] Why This Frothy Market Has Me Scared, Why This Frothy Market Has Me Scared – WSJ, December 17, 2025
[3] Buffett Indicator, Buffett Indicator
[4] Private REITs Offer Stability in Uncertain Political Environments, Private REITs Offer Stability in Uncertain Political Environments | Investment Executive, December 2, 2024
[5] Private Markets Annual Report 2024, https://privatebank.barclays.com/insights/2024/september/private-markets-annual-report-2024/#download
Disclaimer for Skyline Wealth Management:
Skyline Wealth Management Inc. (“Skyline Wealth Management”) is an Exempt Market Dealer registered in all provinces of Canada. The information provided herein is for general information purposes only and does not constitute an offer of securities. Sales of interests in any investments offered by Skyline Wealth Management are only made to certain eligible investors pursuant to regulatory requirements and available exemptions. Any information provided herein is current as at the date of publication and Skyline Wealth Management does not undertake to advise the reader of any changes.
Commissions, trailing commissions, management fees and expenses all may be associated with investments in exempt market products. Please read the confidential offering documents before investing. The indicated rate of return is the annualized return including changes in unit value and reinvestment of all distributions and does not consider sales, redemption, distribution or optional charges or income taxes payable by any unitholder that would have reduced returns. There is no active market through which the securities may be sold, and redemption requests may be subject to monthly redemption limits. The payment of distributions is not guaranteed and may fluctuate. The payment of distributions should not be confused with an exempt market product’s performance. Distributions paid as a result of capital gains realized by an exempt market product, and income and dividends earned are taxable in your hands in the year they are paid. Exempt market products are not guaranteed, their values change frequently, and past performance may not be repeated. Nothing in this email should be construed as investment, legal, tax, regulatory or accounting advice. Prospective investors must make an independent assessment of such matters in consultation with their own professional advisors.