Last year was not a good one for Canadian equities markets, but active portfolio managers performed relatively well amid the gloom.
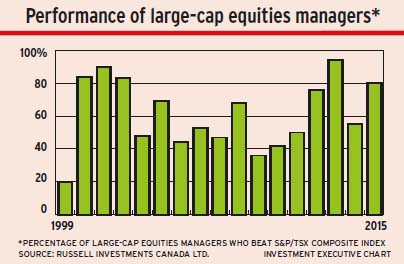
In 2015, 80% of large-capitalization equities portfolio managers beat the performance of their benchmark – the S&P/TSX composite index.
That’s the key conclusion from Russell Investments Canada Ltd.’s most recent active portfolio manager report, which is based on quarterly surveys of 149 Canadian institutional money managers.
Active large-cap portfolio managers benefited from some notable tailwinds last year, especially a down market that saw the S&P/TSX composite index drop by 8.3% during the year, says Kathleen Wylie, head of Canadian equities research at Russell.
“Typically, when the market is down, active managers do tend to beat the benchmark. So, I wouldn’t say it was a surprise,” she says.
Russell’s survey data show that active large-cap portfolio managers improved upon their 2014 performance; 55% beat the S&P/TSX composite index’s return in 2014. Over the past five years, 71% of active large-cap portfolio managers did better than the benchmark index; the median active portfolio manager return was roughly 270 basis points ahead of the benchmark in annual returns.
“There is a lot of negative press about active management, but our data show that it adds value,” says Wylie. “It has been a good five years for active managers.”
Although the environment for active managers’ returns improved during 2015, they received a major boost in the fourth quarter (Q4), when “opportune” stock selection came into play.
Large-cap portfolio managers as a group also were underweighted in key sector underperformers in Q4: energy, telecommunications and health care. For example, the share price for health-care sector giant Valeant Pharmaceuticals International Inc. of Laval, Que., plunged by 41% in Q4, but stock in that firm was held by only 35% of large-cap portfolio managers.
(Interestingly, Valeant produced nightmares for portfolio managers in the first half of last year, rising by 67% and briefly eclipsing Royal Bank of Canada as the largest firm in the S&P/TSX composite index last July.)
Dan Hallett, vice president and principal with HighView Financial Group of Oakville, Ont., says that the Russell data can provide challenges for financial advisors when speaking with their clients. Last year’s performance is, at best, a mixed message.
“[Active portfolio managers] are probably looking relatively better, but the absolute numbers are a lot worse than they were a year ago,” he says. “What advisors might take from this is: ‘It was a really tough environment, but here is where we were able to add some value’.”
Russell’s study found that active growth-oriented portfolio managers (GOPMs) enjoyed better performance vs other investment styles (value, dividend and market-oriented), with 92% of growth portfolios beating the benchmark in 2015, up significantly from 58% in 2014 and well above 2011’s and 2012’s results. Active growth portfolio performance in 2015 was above both the 10-year average of 55% and the five-year average of 61%.
The performance of GOPMs tended to rise and fall in lockstep with Valeant stock during the year, but benefited from the strength of names such as Alimentation Couche-Tard Inc. (up by 25.6% in 2015) and CGI Group Inc. (up by 25.1%).
In 2015, GOPMs tended to be overweighted in information technology (IT) and consumer discretionary, but underweighted in financials and telecom services.
Market-oriented investment managers (MOIMs) scored second best in portfolio returns last year, with 87% of MOIMs beating the benchmark index. That was better than the group’s 76% score in 2014 and higher than its 10-year average of 63% and five-year average of 74%.
The Russell report notes that pinning down general reasons for MOIMs’ success is difficult. This group tended to be overweighted in the consumer discretionary, IT and consumer staples sectors, but underweighted in energy and financials.
Meanwhile, 81% of dividend-oriented portfolio managers (DOPMs) beat the benchmark, up from 36% in 2014 but still off the 2011-13 period, when at least 88% of DOPMs beat the benchmark in each year. DOPMs struggled in the first half of the year alongside value-oriented portfolio managers (VOPMs) when Valeant’s stock performance was strong. DOPMs tended to be overweighted in utilities, consumer discretionary and consumer staples, but underweighted in energy and materials.
As for “out of favour” VOPMs, 67% of this group beat the benchmark in 2015 – up from 45% in 2014, but well below the 93% in 2013 and 97% in 2012.
Compared with GOPMs, sector positioning for the year favoured VOPMs, the Russell report notes. However, performance came down to specific stock choices, with the top 10 contributing stocks held more widely by GOPMs and not one of those stocks widely held by VOPMs.
VOPMs tended to have their largest overweightings in consumer discretionary and IT sectors and their largest underweightings in energy and financials.
“Good active managers just stick with what they do,” says Wylie, “and it works in some periods and it doesn’t in other periods.”
© 2016 Investment Executive. All rights reserved.