Now is an opportune time to examine the prospect of investing in U.S. airline stocks. That’s because after 25 years of lagging the overall market, their prices have broken upward this year.
Above all, this is a sign of a change in airline industry fundamentals – and an indication that big money is moving into these stocks.
Measuring relative strength is a basic tool in stock selection for the long term. A rising or dropping trend of relative strength usually lasts for years, with two to five being the most common.
The U.S. airline industry’s downward trend was unusually long. If past action by this industry repeats, the recent rising trend in relative strength suggests that U.S. airline industry profits will be improving for perhaps 10 to 15 years. That is a flight that any portfolio would hitch a ride on.
Such a change in relative strength holds despite the drop in airline stock prices through September and into October. In a bear market, superior relative strength tends to persist into the following bull market.
The trend of this technical signal indicates changes in fundamentals. Harry Laubscher, a leading technical analyst on Wall Street in the 1970s and 1980s, viewed changes in relative strength as an indicator of the flow of funds.
One such fundamental is airlines’ load factor, or the percentage of seats sold. This metric reached a 10-year industry high at 83.1% in 2013, a marked improvement from the 71.2% level seen in 2005. Then, this past June, the load factor climbed to 86%.
Worth mentioning, though, is that industry consolidation has put a ceiling on the number of flights and seats available. This cuts costs; the industry’s available seat miles dropped to a 10-year low in 2013. Consolidation also means airlines can add to revenue with extra fees – and the era of airlines charging for each piece of checked luggage has begun.
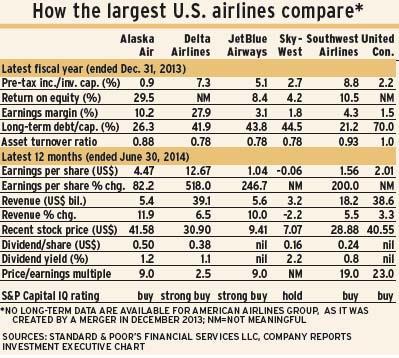
The U.S. airline industry now consists primarily of seven major airlines, of which four are dominant – American Airlines Group Inc. ($27 billion in revenue), Delta Airlines Inc. ($38 billion in revenue), Southwest Airlines Co. ($18 billion in revenue) and United Continental Holdings Inc. ($39 billion in revenue). (All figures are in U.S. dollars and for fiscal and calendar 2013.)
Profitability figures for the 12 months ended June 30, 2014, look unimpressive, but they are much better than they were just a few years ago. (See accompanying table.) What is impressive is the revival of earnings vs a period when most airlines produced losses.
American Airlines came into being in December 2013, in a merger between bankrupt AMR Corp. and U.S. Airways Group. The merged company expects to receive a single operating certificate late in 2015.
As a result, the new company has no long-term financial data. But the first two quarters of 2014 are optimistic, as the firm showed after-tax profits for both periods.
Delta Airlines merged with Northwest Airlines in 2008, and recent results indicate the benefits of the merger are beginning to show. In 2012, Delta Airlines bought an oil refinery in Philadelphia and is converting it to increase its jet-fuel production. This should cut Delta Airline’s fuel costs, which averaged 31% of all large airlines’ costs in 2013.
Southwest Airlines has long been the only consistently profitable large airline, operating like a low-cost bus line for business travel over non-stop routes. The firm expanded in 2011 by buying Air Trans Airlines, extending its reach across the U.S.
United Continental came into being in 2010. The merged firm operates as United Airlines, but its aircraft fly in former Continental Airlines colours. Integration continues, and the firm’s financial results reflect that. The company has yet to produce profits in four consecutive quarters, but is widely expected to be profitable in 2015.
© 2014 Investment Executive. All rights reserved.