If you’re wondering which industries you should be focusing on in your clients’ portfolios, a look at very long-term trends in relative performance may be helpful.
“Very long-term” refers to trends that last for years or even decades. Being invested in market-beating industries cuts risk and boosts returns. Being locked into an industry or sector that’s lagging the market damages a portfolio’s results and increases risk.
Industry performance plus the broad market trend together account for 80%-90% of a stock’s performance, as various studies have indicated.
Our look at the directions that Canadian market sectors are taking has an unusual basis, in that Investment Executive has measured industry performance against the S&P 500 composite index.
Reasons for stepping away from a Canadian benchmark index are headed by the Canadian stock market’s significant weighting on financial and resources stocks. The S&P 500 is better balanced and better representative of the international industrial structure.
In addition, Canada’s stock market swings with Wall Street’s gravitational pull. There’s as much as a 90% correlation between the two markets.
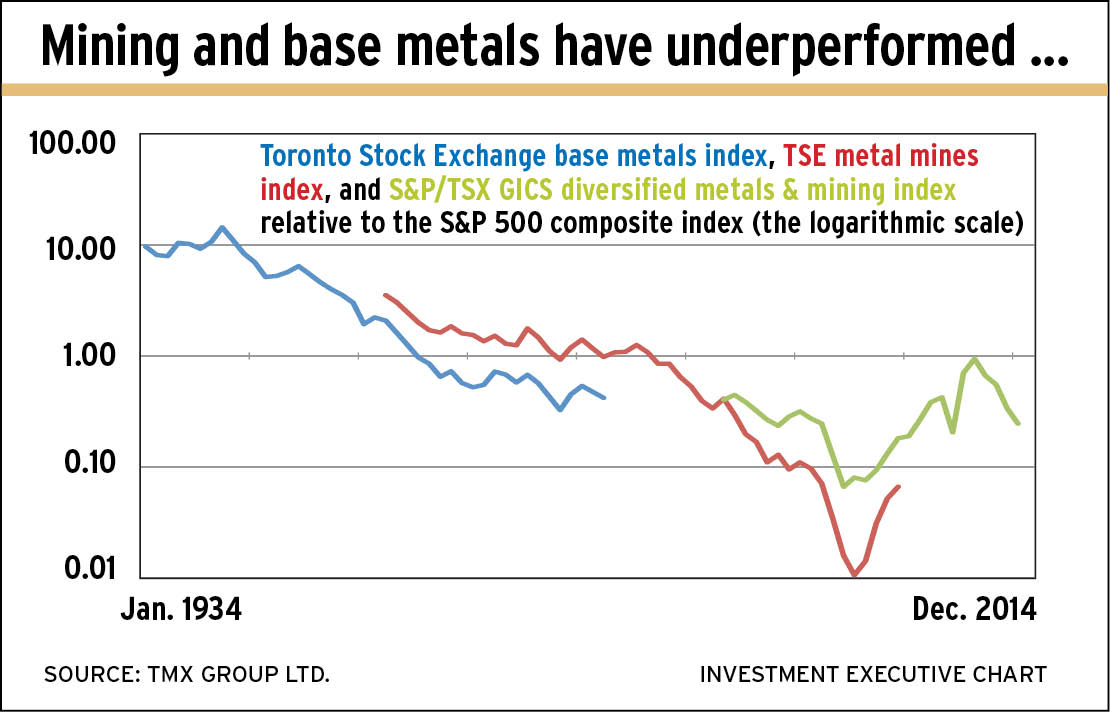
A look at very long-term trends in relative performance for the three dominant Canadian sectors may be discouraging. (See accompanying charts at right.) All three have been dropping relative to the U.S. market for years.
The charts display three sets of sector indices against the S&P 500. The longest – for banks – starts in 1919 with the first security price indices published by the Dominion Bureau of Statistics, later renamed Statistics Canada.
Data for energy (oil and gas producers) and mining (base metals) come from three Toronto Stock Exchange index series.
The very long trend for the mining sector is fairly simple and illuminating. These stocks underperformed from the first base metals index’s inception in 1934 until 1999. An 11-year bull trend followed, relative to the U.S. market, but that ended five years ago.
The energy picture, beginning in 1938, reveals a similar drawn-out drop in relative strength – broken by a five-year bull trend from 1964 to 1979 – to a low in 1999. After a rise starting in 1999, relative performance has been dropping since 2009.
Bank stocks now are viewed as being reliable, steady dividend-payers and growth stocks. The history of these stocks shows they can be otherwise. Note the volatility of relative performance in the long drop through the 1920s and 1930s – a trend that finally ended in 1967. Also note the huge rise from 1967 to 1978 and the almost equally stunning drop in relative strength until 1999.
The banks’ current slide relative to the benchmark S&P 500 now is five years old – and you could look in vain for signs of revival.
Here are the patterns of relative performance among other sectors of the Canadian market:
– Utilities have tracked a path similar to mining and oil – a long drop in relative strength from 1987 to 1999, then a rise almost to equal its 1987 high ending in 2009, and a subsequent drop.
– Health care occupies a small space in the Canadian market, typically dominated by one or two stocks. Relative to the S&P 500, the Canadian health-care index dropped from 1995 to 1999, then rallied to 2001, then dropped for the next seven years. Since 2008, though, a few health-care management and biotechnology stocks led the sector to a new relative high before Laval, Que.-based Valeant Pharmaceuticals International Inc.’s drop ended that spectacular rise.
– Industrials dropped relative to the S&P 500 from 1987 to the transition year of 1999. After a two-year rise in relative strength, Canadian industrials have tracked the S&P 500 closely since. Relative strength now is rising gently.
– Telecommunications services enjoyed a big rise in relative performance between 1998 and 2000, the tail end of the high-tech boom. After that, telecoms have played tag with the S&P 500 with short swings. Since 2009, the relative strength has trended downward.
– Consumer stocks represent a bullish scene. Consumer staples is the standout sector. It dropped in relative strength until 1999; then a sharp rise lasting two years put the sector on a stock price plateau. Relative strength has reached new highs in 2002, in 2009 and in July 2015.
Consumer discretionary, the larger consumer sector, has been less volatile. This index tracked the dropping strength of the overall Canadian market relative to the S&P 500 until 1999, then gained for two years after that. Since 2002, discretionary stocks have oscillated close to the S&P 500’s level. Relative strength finally pushed above the 2002 high in September 2015.
© 2016 Investment Executive. All rights reserved.