Retailing is a tough business, as anyone who’s in it – whether a street-corner convenience-store owner or a top executive with a merchandising colossus – will tell you. And the sector isn’t getting easier, as the issues are long-term in nature.
Sales growth is meagre. Since 2008, annual revenue gains have been well below the average gains of the seven years before. Profitability and return on equity (ROE) also have been dropping in this sector since 2009, as has net margin since 2010.
There is one segment of retailing that has done very well: food and consumer staples retailing, the latter of which mainly are drugstores.
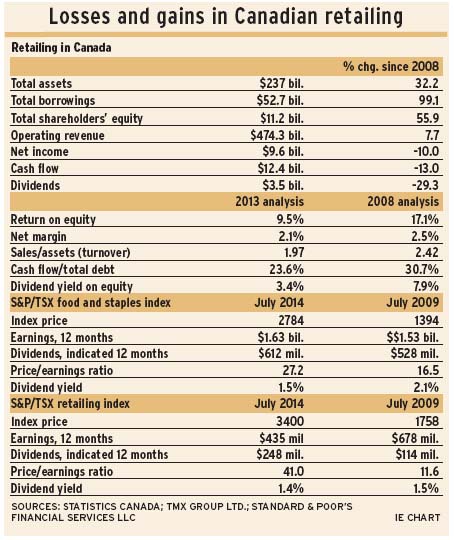
Analysis of Statistics Canada data reveals that ROE for all retail enterprises dropped to 9.5% in the year ended Dec. 31, 2013, from 12% in the 12 months ended June 30, 2009.
Margins also have dropped since the 12 months ended Sept. 30, 2010. Net income per dollar of sales peaked then, at 2.8¢ per $1 of operating income. That was the highest level since 2000. In 2013, margins shrank to 2.1¢ per $1 of operating income.
Operating revenue rose by 3% in 2013, better than the average growth of 2% achieved in the years from 2008 to 2013. However, sales gains have been markedly smaller since 2007 than in the years prior, as sales growth averaged 7% a year from 2001 to 2007.
In 2013, net income dropped by 15.5% and cash flow dropped by 13.5% year-over-year. That resembled the recession year 2009, when both net income and cash flow also dropped.
In the stock market, two indices represent the investor-owned segment of retailing:
– The S&P/TSX retailing index accounts for 1% of the S&P/TSX composite index’s earnings and 0.5% of indicated dividends.
This index is in the consumer discretionary sector, and its main subindustry is general- merchandise stores.
– The S&P/TSX food and staples retailing index accounts for 3.4% of the S&P/TSX composite index’s earnings and 1.2% of dividends.
This index is the dominant component of the consumer staples sector. Over the long term, food and consumer staples have outpaced the rest of the stock market by a country mile.
In contrast, the retailing index has not kept pace. In 2013, this index finally reached the level of its previous high, which was reached 25 years prior. This index traced a monthly closing high of 3521 in April this year, which was 8.5% above the 1989 peak.
From the 1989 high, the retailing index climbed by 4.7% to its April high while the S&P/TSX composite index rose by 289.6% in the same period.
Since the market low in 2009 to July 2014, retailing index earnings have dropped by 40.2%, while indicated dividend payments have risen by 115.5%.
And the subgroup is no breakout bargain. The retailing index trades at 41 times earnings and its dividend yield is a scant 1.4%, meaning you pay $71.95 to earn $1 in annual dividends. That’s with a 57% payout ratio, highest on record since 2002.
As mentioned above, within the retailing index is one important subindustry: general-merchandise stores. There also are subindustry indices for home-improvement retailing and department stores, as well as for a recent addition, automotive retailing. Gone is the industry subindex for apparel retailing.
<
The story is far better for the food and staples industry index, which has risen by 1,325.3% (or by 14.3 times) since its inception in 1987. That rate trounced the S&P/TSX composite index, which rose by 385.8%, or by 4.9 times, during that same period.
In the shorter run, food and staples stocks have risen by 109.2% from their latest low in July 2008, vs a 12.9% rise by the S&P/TSX composite index during the corresponding period. Still, this index remains below its highest point relative to the S&P/TSX composite index, which was achieved in 2002.
There have been five “buy” points for the food and staples index, going by lows in relative strength: in 1994, 1996, 2000, 2008 and 2011. The index also was a “buy” in 2010, when dividend yield hit a high of 2.3%.
Food and staples are a better bargain than the retailing index, judging by the current price/earnings (P/E) ratio of 27.2 and dividend yield of 1.5%. But the P/E has not been as high nor the dividend yield as low since 2007.
The dividend payout ratio is 27%, almost reaching the nine-year average ratio of 30%.
Retailing also is having a difficult time in the U.S. Retail and food services sales growth has dropped since 2011. Year-over-year retail sales growth peaked at 6% then; now, it’s almost 2%.
In the seven months ended July 31, only drugstores, among all retailers, have gained on the stock market. They are up by 11.5% year to date. In the S&P 500 composite index, hypermarketers (Wal-Mart Stores Inc., Costco Wholesale Corp.) have dropped by 5%; home furnishing, by 21.2%; and computer/electronics, by 21.8%.
Many U.S. retail groups have been underperforming for years. For example, relative to the S&P 500, apparel retailing made its high in 1999, home improvement in 2002, Internet retailing in 2004 and hypermarketers in 2009.
© 2014 Investment Executive. All rights reserved.