You have a hard decision to make if your clients own biotechnology stocks – or want to buy them.
This industry has had a terrific run. The Standard & Poor’s biotech select industry index is up by 368% since June 2010. One exchange-traded fund (ETF) – iShares Nasdaq Biotechnology ETF (symbol: IBB), which includes a much wider swath of stocks – has climbed by 525% since 2008.
But in the final week of April, biotech stocks took a beating. IBB dropped by 9%, and the S&P biotechnology index declined by 6%.
Is this another zigzag in an overall bull market? Perhaps.
After 15 years of a secular rising market trend, capped by the latest five-plus years of market-leading increases, wondering whether the run on biotech stocks is now ending is only natural. But, as technical analysts read the action, still higher gains are possible from many of these market-leading stocks.
On the other hand, a division among types of biotech stocks may be developing. Although most of the largest-cap biotech stocks have weakened relative to the broad market, bullish candidates have emerged among medium-cap and small-cap shares.
For large-cap biotech stocks, relative strength will provide the earliest indication of the market’s long-term opinion about this group. Among the 10 largest stocks in the biotech industry, three have continued to rise relative to the overall market: Mylan NV (symbol: MYL), Vertex Pharmaceuticals Inc. (symbol: VRTX) and BioMarin Pharmaceutical Inc. (symbol: BMRN). The 12th-largest stock, Endo International PLC (symbol: ENL), has done the same.
IBB includes 148 stocks, the largest number among current biotech ETFs. Individual IBB weightings range from a high of 8.6% to a low of 0.03%. The 10 largest stocks in IBB account for 61% of this ETF; the next 10 stocks, 17%. That leaves a 22% weighting for the remaining 128 stocks in this broad biotech index.
Other biotech ETFs contain fewer stocks, and most tend toward equal weighting of holdings. For example, SPDR S&P Biotech ETF (symbol: XBI) holds 99 stocks, with individual stock allocations ranging from 1.5% to 0.6%.
The most equally balanced of the biotech ETFs is First Trust NYSE Arca Biotechnology Index Fund (symbol: FBT). The individual weightings of its 30 stock holdings range between 3.7% and 3.1%.
PowerShares Dynamic Biotechnology & Genome Portfolio (symbol: PBE) holds 30 stocks, with weightings of 5.9% to 1.8%. Global Biotech Portfolio (symbol: PBTQ), another PowerShares product, holds 42 stocks, weighted between 8.8% and 0.1%. Van Eck Biotech ETF (symbol: BBH) contains 26 stocks, weighted at 15% to 0.5%.
Signals of growth opportunities, based on market action, appear strongest among medium- and small-cap biotech companies, especially among research-oriented enterprises. These firms identify biotech companies for detailed fundamental analysis. Most of these biotech companies have little or no sales. They exist instead on incoming investment to fund their research.
Biotech research firms resemble exploration stocks in the mining and oil sectors, with a significant difference. There are only half a dozen or so metals or minerals being sought, but there are countless biological compounds being searched for and tested to treat an endless number of diseases and conditions.
As a result, biotech research tends to run in highly specialized and differentiated directions. That creates a problem for investors: with so many prospects, it is difficult to make informed choices. ETFs are one solution, with IBB favoured by many investors because of its wide reach into small companies.
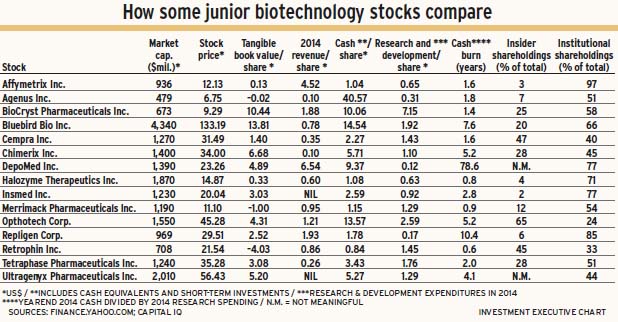
For these biotech research firms, “cash burn” is key – that is, how long a research program can be financed with the cash on hand. This in turn puts a premium on the ability of these firms to raise money.
It also creates additional pressure to produce encouraging results. Failure to do so is punished severely: an 80% stock price drop after a failed clinical trial is typical.
Some small-cap biotech stocks showing promising market action recently are listed in the accompanying table, with the projected cash burn as of their financial yearend in 2014.
© 2015 Investment Executive. All rights reserved.