The investment side of insurance advisors’ businesses are gaining significance. This aspect of advisors’ books of business continues to grow while the core insurance business remains static.
The results of Investment Executive’s 2015 (IE‘s) Insurance Advisors’ Report Card reveals continued gains in assets under management (AUM) for the average insurance representative compared with little change in many other aspects of advisors’ books.
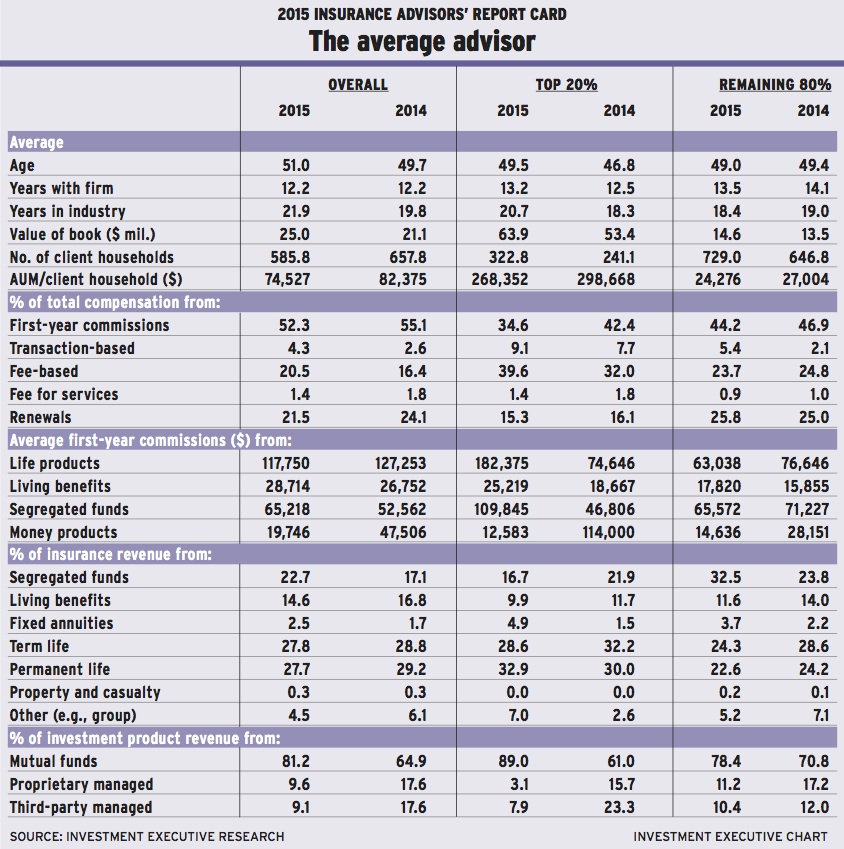
The average advisor in the insurance channel is now 51 years old, with 21.9 years of experience in the business and 12.2 years at his or her current firm. Although the average advisor’s average tenure with his or her current firm is unchanged from last year, the other two metrics have increased from the previous survey, when the average advisor was 49.7 years old with 19.8 years of experience in the business.
These changes indicate that the advisor population in the insurance channel is fairly stable and that no major demographic change has occurred within the advisor population – such as a wave of retirements or an influx of rookies – to alter the basic profile of the average advisor meaningfully.
Yet, there have been some notable changes, at least within the investment component of advisors’ books of business. For example, average AUM is up to $25 million from $21.1 million in 2014. At the same time, advisors reported that the average number of client households they are serving declined over the past year to 586 this year from 658 in last year’s survey.
The picture looks a bit different when the advisor population is divided into the top 20% and the remaining 80%, based on the productivity of the investment component of advisors’ books, with AUM/client household serving as the basis of segmentation.
Admittedly, this metric isn’t as relevant in the insurance industry as it is for traditional investment channels such as brokerage firms, mutual fund dealers and even banks and credit unions.
Furthermore, there is a caveat: the comparable data for the two advisor segments come from relatively small sample sizes. More than half of the advisors in the overall survey didn’t provide either their AUM or the number of client households they serve. Thus, those advisors were excluded from IE‘s segmentation, which makes both segments’ numbers more volatile and less reliable.
Still, both segments of the insurance advisor population who reported both their AUM and number of client households have certain basic trends in common. Over the past year, the average advisor in both segments saw his or her AUM grow while the number of client households served has risen even faster, driving down productivity.
The top performers boasted much higher average AUM and much smaller client bases vs the remaining 80% of advisors. The average top performer reported AUM of $63.9 million, up from $53.4 million in last year’s survey, more than four times the $14.6 million in AUM reported by the average advisor in the remaining 80% of the population this year.
At the same time, the average top performer reported serving 323 client households, up from 241 client households last year. In comparison, the average rep in the remaining 80% of advisors reported having 729 client households, up from 647 client households in 2014.
The combination of modest growth in AUM and much faster growth in client numbers resulted in a decline in average productivity of 10% for both sides of the business. For top performers, AUM/client household declined to $268,352 from $298,668 year-over-year. And for the remaining 80% of advisors, the decline in average productivity dropped to $24,276 from $27,004 in last year’s survey.
Despite the decline in productivity, the rise in AUM for both segments of the advisor population signals increasing importance of the investment component of the average book of business. This trend is echoed in other aspects of the data as well, such as increased allocations to segregated funds within the average advisor’s insurance revenue.
For the overall population of advisors, the share of the average insurance sales from seg funds is up to 22.7% from 17.1% year-over-year. At the same time, first-year commissions from seg funds are up to $65,218 from $52,562.
Looking at the product distribution data, the rise in allocations to seg funds is at the expense of most major insurance product lines, including both term and permanent life insurance and living benefits.
On the investment side, mutual funds are capturing a greater share of the average book at the expense of both proprietary and third-party managed products. Allocations to stand-alone mutual funds rose to 81.2% from 64.9% year-over-year, whereas both proprietary and third-party managed products dropped to 9.6% and 9.1%, respectively, of the average book from 17.6% each last year.
© 2015 Investment Executive. All rights reserved.