
PAID CONTENT
For at least the last 50 years, investors have successfully grown their assets by taking a 60/40 stocks-to-bonds approach to portfolio construction. Until now, that split worked well, outperforming a bond-only portfolio by a wide margin and delivering only modest underperformance, but with much less volatility, than an equities-only portfolio.
As interest rates and inflation have climbed, correlations between stocks and bonds have increased, which has made it increasingly difficult to build a properly diversified portfolio. In this environment, advisors must pay close attention to not just returns, but Quality of Returns, which involves keeping losses at more acceptable levels during periods of market volatility. The point is to give their clients the confidence they need to stay invested in all market conditions.
Because of the changing relationship between stocks and bonds, a new investing framework is needed. Advisors should consider adding extra layers of fortification to a portfolio and look beyond the two traditional asset classes when building a portfolio.
How we build fortified portfolios
While the correlation challenge may be more pronounced today, at PICTON Investments we have been thinking about ways to improve Quality of Returns for years. The approach we’ve developed over 20 years is anchored in a four-layer framework that aims to achieve the highest level of return for a specific amount of risk.
Our framework consists of a:
- Base layer of traditional and alternative assets and strategies that aim to provide stable, long-term returns.
- Tactical economic cycle adjustment layer that shifts the weights of the first layer with the goal to maximize returns and minimize risk across different macroeconomic environments.
- Factor risk premia layer that employs equity market-neutral, long/short, factor investing as well as other alternative multi-asset risk premia strategies
- Portfolio management expertise layer (also called alpha) that adds further diversification through a manager’s own investment style.
Alternative investments are core to our framework, allowing us to shift to a 40/30/30 portfolio away from a traditional 60/40 portfolio. That’s 40% equities, 30% fixed income and 30% alternatives, the latter of which can include alternative assets, such as commodities that can help diversify a balanced portfolio beyond stocks and bonds, and alternative strategies such as market-neutral, long/short, and /or factor investing that aim to offer additional return streams that are uncorrelated to traditional assets.
Fortification level 1: Diversify Strategically Across Asset Classes
Stocks and bonds typically form the foundation for long-term investment portfolios, but you now need a broader range of asset classes, both to enhance diversification and for liquidity. When developing the PICTON Fortified Portfolio approach, we applied quantitative methods to hundreds of assets, analyzing returns, risk metrics, correlations and economic cycle behaviour to create nine distinct asset class groups.
They include:
- Interest rates
- High-yield credit
- Investment-grade credit
- Precious metals
- Industrial metals
- Energy
- Grains
- Developed markets equity
- Emerging markets equity
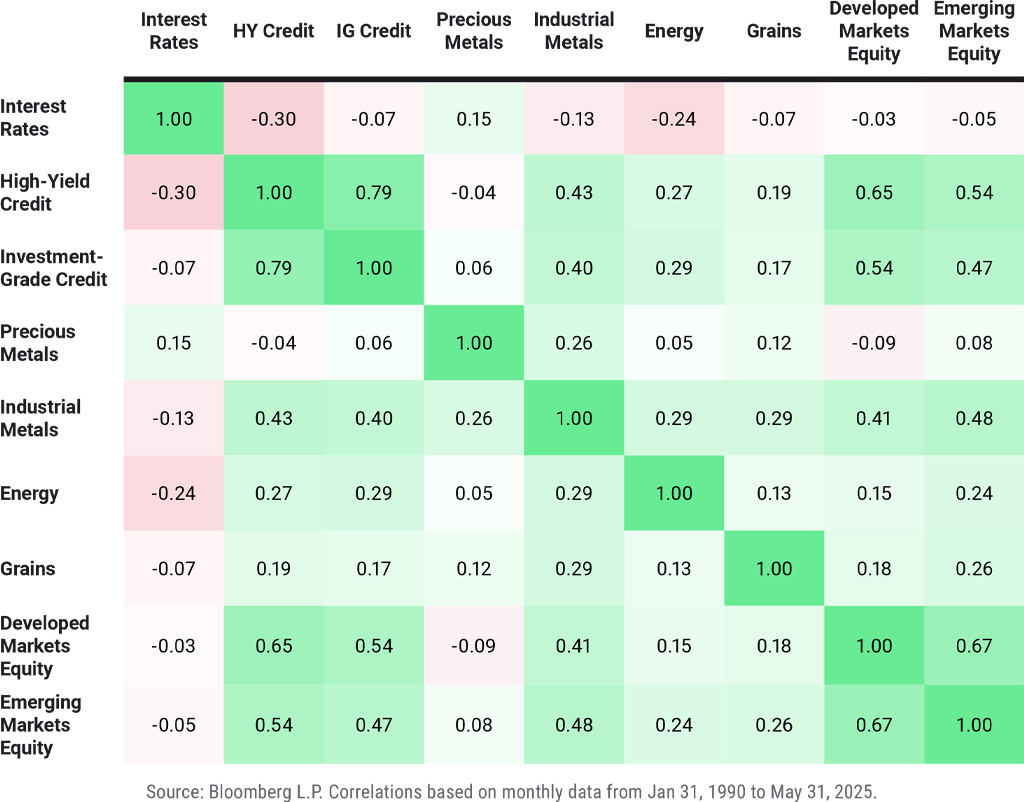
These assets classes have performance characteristics that differ from each other, and that’s key: if the assets in portfolio exhibit return or performance characteristics that are different from one another, then the Quality of Returnswill likely be stronger. The portfolio will likely be less volatile, which can help to smooth out returns.
In this chart, you can see how each asset class’s monthly returns are correlated to one another. The shades of green represent a positive correlation (darker is higher) and the shades of orange represent a negative correlation (darker is lower). White is relatively neutral correlation, where the behaviour of one asset class cannot really be explained by the behaviour of another.
Fortification level 2: Tactical Economic Cycle Adjustment
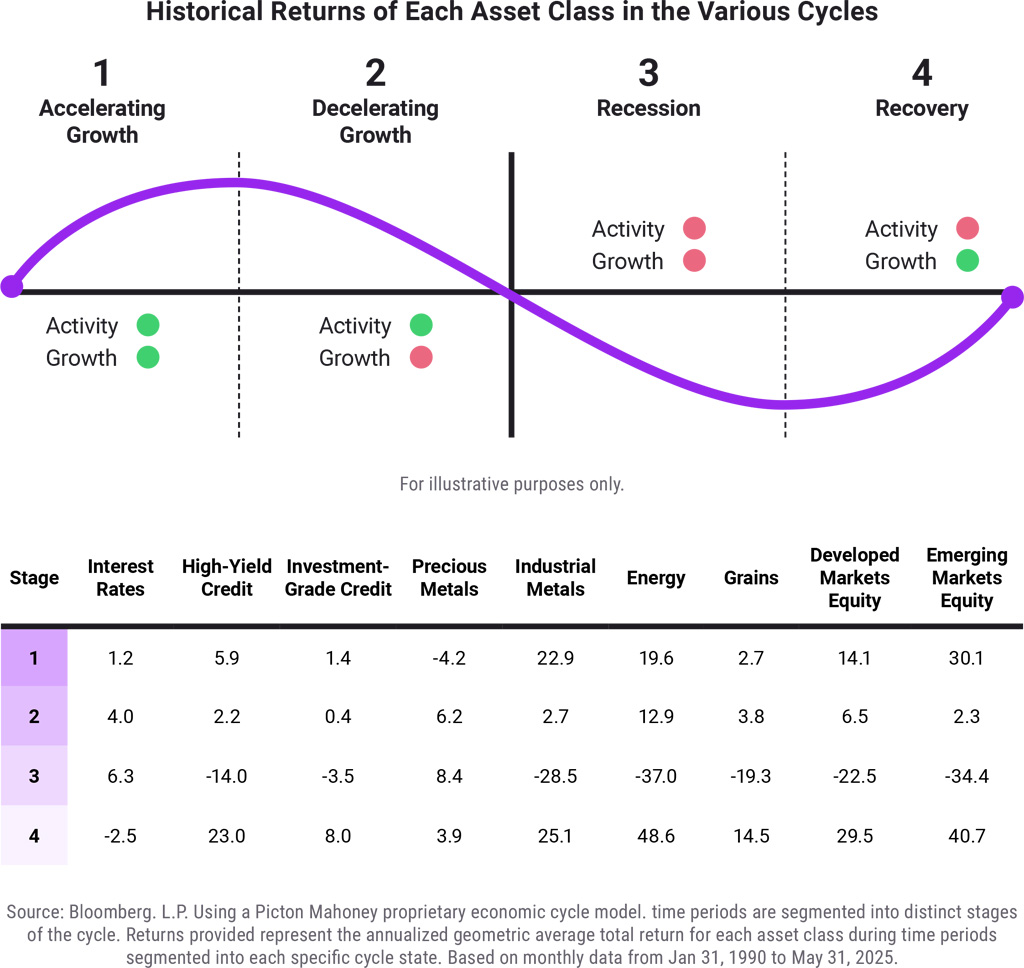
The second part of our framework centres around the economic cycle and how the nine asset classes we’ve identified perform within different parts of the cycle. We’ve segmented it into four broadly recognized phases: accelerating growth, decelerating growth, recession and recovery. The more you know how each asset class behaves in each stage, the better chance you’ll have of building a resilient, forward-looking portfolio.
As an example, developed market equities generally have a low sensitivity to inflation, while companies within the interest rate asset class could show a negative return to inflation. Energy tends to outperform during inflationary times. Knowing this kind of information allows us to tactically adjust our strategic asset allocation to better align with current economic conditions.
In times of more market stress, we add an additional layer of protection with a CBOE Volatility Index (VIX) hedge, which can cushion portfolios during steep market declines. By taking a tactical approach and volatility positioning, we can fortify portfolios through the natural ebbs and flows of economic cycles.
Historical returns of each asset class in the various cycles
Fortification level 3: Tactical economic cycle adjustment
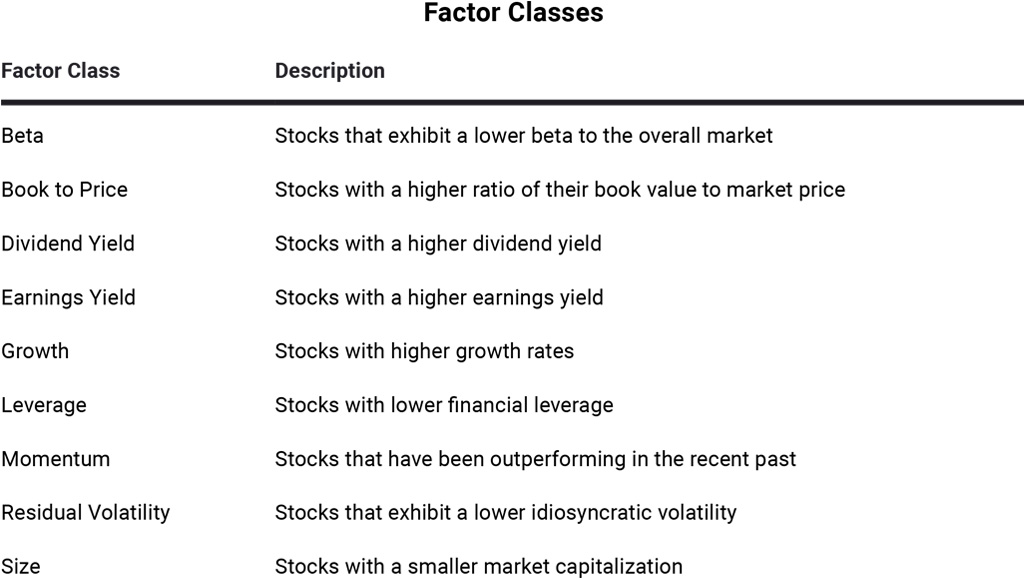
The next part of the framework is around factor risk premia investing, which involves isolating and investing in factors that can contribute to asset class returns over time. We break factor risk premia into two broad categories: single name equity factor risk premia and multi-asset factor risk premia.
Traditional equity portfolios tend to be long-only, which means managers buy stocks outright. Returns depend largely on overall market movements. In our framework, if we use long-short strategies to buy undervalued stocks while selling overvalued ones, we can isolate the return from specific factors, such as value, which can reduce exposure to broad market swings.
Value and momentum are two of the factors we use to implement our third level of fortification. Here are other factor classes that should be considered.
Fortification level 4: Portfolio manager expertise (alpha)
The last layer is around alpha, or a portfolio manager’s ability to outperform. Historically, alpha was measured by how much a manager could beat its benchmark, but that definition has evolved. True alpha is now looked at as the return a manager delivers after stripping out all systematic risks, including market exposure and known factor premia.
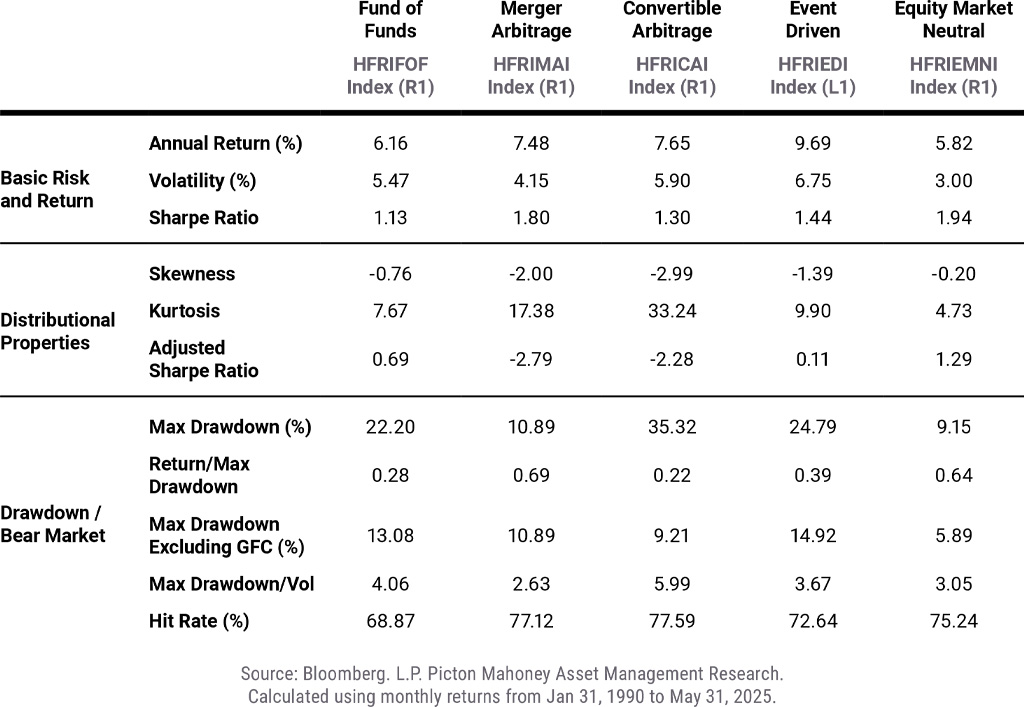
While these strategies have typically generated positive returns over time, they’re built to have a low correlation to the first three levels of fortification, and other return sources, which aim to boost the Quality of Returns of the entire portfolio.
In this chart, you’ll see Quality of Returns data for indexes that represent several hedge fund strategies that tend to have the least overlapping exposure to our first three levels of fortification. The strategies we examine are fund-of-funds, merger arbitrage, convertible arbitrage, event-driven and equity market neutral.
Combining it all: How the four levels of fortification can enhance Quality of Returns
If you carefully choose the right investments, understand how each behaves in different parts of the economic cycle and pull it all together in the right way, you’ll get a much stronger portfolio that improves Quality of Returns. Our fortification process has been shown to deliver better risk-adjusted returns than the traditional 60/40 asset mix.
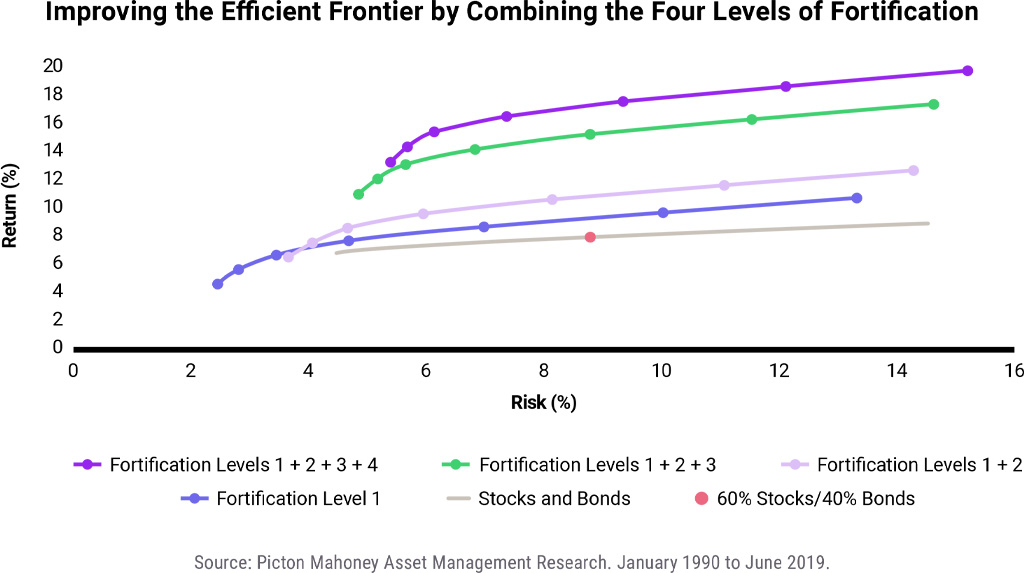
In this chart, you can see how the different levels of fortification improve the Quality of Returns in our portfolio. Each line represents an “efficient frontier,” which shows the highest return an investor could expect for a given level of risk. As the levels build, the frontier shifts upward, meaning more return is gained for the same risk (or the same return for less risk).
These results are based on historical data and some of the advantages may decrease over time as markets become more efficient, but we believe this framework remains a more resilient and forward-looking approach than the traditional 60/40 portfolio still widely used today.
Improving the efficient frontier by combining the four levels of fortification
The bottom line: the world has evolved significantly over the past several decades, yet portfolio construction has largely stayed the same. With market volatility likely not disappearing any time soon – and with inflation remaining sticky and interest rates still high compared to the near-zero levels we saw over the past decade – fortifying your portfolios through a 40/30/30 approach will be key. If you focus on Quality of Returns and building strong, resilient and adaptable portfolios, you’ll likely find success not just today, but for the next 50 years.
Disclosure:
This material has been published by Picton Mahoney Asset Management (“PICTON Investments”) on June 16, 2025. It is provided as a general source of information, is subject to change without notification and should not be construed as investment advice. This material should not be relied upon for any investment decision and is not a recommendation, solicitation or offering of any security in any jurisdiction. The information contained in this material has been obtained from sources believed reliable, however, the accuracy and/or completeness of the information is not guaranteed by PICTON Investments, nor does PICTON Investments assume any responsibility or liability whatsoever. All investments involve risk and may lose value. This information is not intended to provide financial, investment, tax, legal or accounting advice specific to any person, and should not be relied upon in that regard. Tax, investment and all other decisions should be made, as appropriate, only with guidance from a qualified professional.
The data presented in this material is hypothetical in nature, designed with the benefit of hindsight and based on historical index performance to which various assumptions, calculations and/or modelling have been applied. In such instances, no allowance has been made for transaction costs, management fees, commissions, trailing commissions, expenses, implementation shortfalls or other costs which would typically reduce the returns to an investor. The results of hypothetical performance are not indicative of any specific investment. Past performance, including simulated performance, is no guarantee of future performance, and actual investment results may differ significantly.
Any information and data pertaining to an index contained in this document relate only to the index itself and not to any asset management product based on the index. Indices have limitations because indices have volatility and other material characteristics that may differ from an actual portfolio. For example, investments made for a portfolio may differ significantly in terms of security holdings, industry weightings and asset allocation from those of the index. Accordingly, investment results and volatility of a portfolio may differ from those of any index referenced. Also, indices are unmanaged, are not available for direct investment, and are not subject to management fees, performance fees, commissions, trailing commissions, transaction costs or other types of expenses that a portfolio may incur. In addition, the performance of the indices reflects reinvestment of dividends and, where applicable, capital gain distributions. Therefore, investors should carefully consider these limitations and differences when evaluating the index performance.
Hypothetical or simulated performance results have certain inherent limitations. Unlike an actual performance record, simulated results do not represent actual trading, but are based on the historical returns of the selected investments, indices or investment classes and various assumptions of past and future events. Simulated trading programs in general are also subject to the fact that they are designed with the benefit of hindsight. Also, since the trades have not actually been executed, the results may have under or overcompensated for the impact of certain market factors. In addition, hypothetical trading does not involve financial risk. No hypothetical trading record can completely account for the impact of financial risk in actual trading. For example, the ability to withstand losses or to adhere to a particular trading program in spite of the trading losses are material factors which can adversely affect the actual trading results. There are numerous other factors related to the economy or markets in general or to the implementation of any specific trading program which cannot be fully accounted for in the preparation of hypothetical performance results, all of which can adversely affect trading results. The simulated performance results also assume that asset allocations, securities or investments would not have changed over time and in response to market conditions, which might have occurred if an actual account had been managed during the time period shown.
In the case of an investment fund, the investment fund must prepare disclosure documents that contain key information about the investment fund (for example, a prospectus for a mutual fund). Investors must refer to such documents before investing. Also, investors will usually pay brokerage fees to the dealer if the investor purchases or sells units of the investment funds on the market or exchange on which such units are traded. If the units are purchased or sold on such markets or exchanges, investors may pay more than the current net asset value when buying units of the investment fund and may receive less than the current net asset value when selling them.
This material contains “forward-looking information” that is not purely historical in nature. These forward-looking statements are based upon the reasonable beliefs, expectations, estimates and projections of PICTON Investments as of the date they are made. PICTON Investments assumes no duty, and does not undertake, to update any forward-looking statement. Forward-looking statements are not guarantees of future performance, are subject to numerous assumptions, and involve inherent risks and uncertainties about general economic factors which change over time. There is no guarantee that any forward-looking statements will come to pass. We caution you not to place undue reliance on these statements as a number of important factors could cause actual events or results to differ materially from those expressed or implied in any forward-looking statement made.
All projections provided are estimates and are in Canadian dollar terms, unless otherwise specified, and are based on data as of the dates indicated.
© 2025 Picton Mahoney Asset Management. All rights reserved.