

Against a backdrop of continued strength in global financial markets last year, mixed-dealer and mutual fund-only advisors managed to grow their businesses, too — but the underlying dynamics of that growth varied widely. The industry’s top producers added clients and assets, while everyone else enhanced their productivity by rationalizing their client rosters.
Investment Executive’s 2026 Dealers’ Report Card incorporated two new firms this year — Designed Wealth Management and Sun Life — expanding the breadth of our industry coverage but complicating year-over-year comparisons.
Click the image below to view the data and enlarge it.
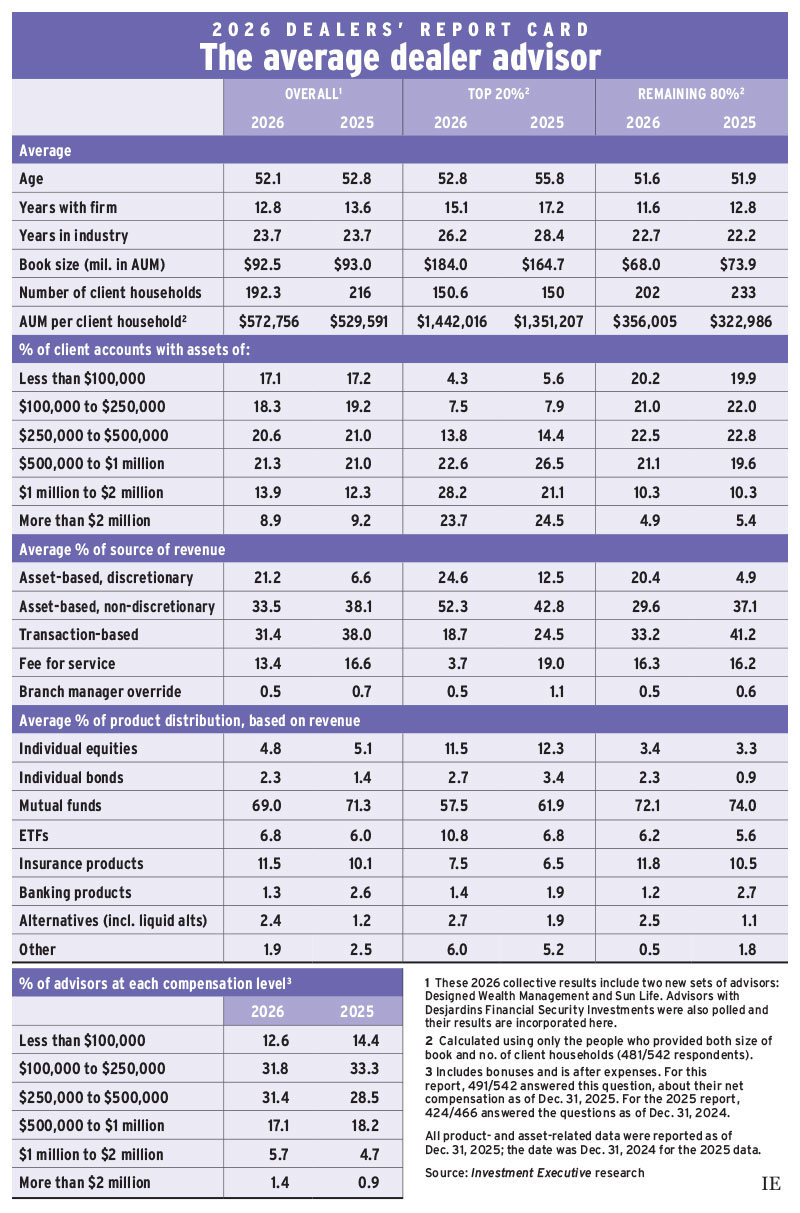
On some metrics, such as average advisor age and industry experience, adding the new firms made little difference. The average age of advisors in the research remains right around 52 years; the average dealer advisor has around 24 years of industry experience; and has been with their current firm for approximately 13 years.
The biggest impact of the expanded survey population is evident when it comes to assets under management (AUM) for the average advisor in our research. For all 13 firms included in this year’s DRC, average AUM came in at $92.5 million, down slightly from $93 million last year. When the new firms are excluded, however, average AUM was $98.4 million — representing a modest increase in assets on a year-over-year basis.
Moreover, this asset growth came alongside a decline in average client numbers — indicating an increased emphasis on higher-value clients across much of the fund dealer business.
The average advisor in our survey reported they served 193 households (including the new firms, the average is 192), down from 216 households in last year’s research. The increase in average AUM combined with a drop in the volume of clients being served by the average advisor, means that average productivity — defined as AUM per client household — was up from last year too.
This year, average AUM per client came in at $572,756. Excluding the two new firms from the data, that number rises to $591,336 — which represents a healthy jump from $529,591 last year.
Top performers
Some of these same trends are also evident when we compare the top 20% of the advisor population (measured by AUM per client) to the other 80%. For both segments of the industry, there are no statistically significant differences between the full survey population and a sample that excludes the two new firms when it comes to age and industry experience. But there is a difference in terms of assets and productivity.
For the top-performing dealer advisors across all firms in this year’s research, average AUM was $184 million. If we exclude the new firms, average assets were just shy of the $200-million mark, at $197.8 million. That’s a jump of around 20% from the $164.7 million in average assets reported by top performers in last year’s report.
This strong gain in average assets for the top performers is partly the result of strong markets, but it also reflects an increase in client numbers for this segment of advisors. Excluding the two new firms, the top performers reported serving 158 households on average in this year’s report, up from 150 the previous year. Average AUM per client for these advisors also rose to just over $1.5 million from $1.35 million. Including the two new firms in the research, the average AUM per client comes in a bit lower at $1.44 million and their number of client households remains the same.
It’s a similar story for the dealer advisors that make up the other 80% of the industry: average AUM and average productivity are a bit higher when the two new firms are excluded from the data. For this remaining 80% segment, average assets across the group came in at $68 million and average AUM per client was $356,005. Excluding the new firms, average assets were $70.9 million and average AUM per client came in at $364,297.
Shift to larger accounts continues
Alongside the notable difference in average assets — and the related impact on average productivity — the addition of the two new firms impacted the data in other areas, too.
For instance, there were some modest differences when it came to the account distribution data — also a reflection of the impact on assets, as the drag from including firms that reduce average AUM skews that distribution in favour of smaller accounts.
Excluding the new firms, the average advisor in this year’s DRC reported that 23.8% of their book was allocated to accounts worth $1 million or more. But that drops to 22.8% when the two additional firms are included in the sample.
That’s not a huge difference, but it does have the effect of understating the shift towards larger accounts that is revealed by a straightforward comparison with last year’s data, when advisors reported that 21.5% of the average book was allocated to accounts over $1 million.
The trend to larger account sizes is even more notable among the industry’s top-performing reps. In 2025, the average top performer reported that 45.6% of their book was in $1-million-plus accounts. In this year’s research, that share has jumped to more than 50%.
These kinds of differences are much less significant outside of the top-performer cohort. Among the other 80% of advisors, the average dealer advisor’s account distribution is similar, whether the two new firms are included in the data. For example, in this segment of advisors, the average allocation to accounts worth over $1 million is 15.2% across the total research sample. Excluding the new firms, the average allocation to these accounts is 15.7% (unchanged from the prior year).
Turning to the data on product distribution, there’s very little difference between including the additional firms and leaving them out. The most notable distinction is that allocations to insurance products are slightly higher when the new firms are included — 11.5% compared to 10.3% if the new firms are excluded. Conversely, allocations to mutual funds are slightly lower with the new firms included — 69% versus 70.6% when they’re excluded from the data.
Keeping the survey population consistent year over year reveals actual shifts in asset allocation within the industry, versus changes that are also the result of the evolving composition of the firms in the research. On that basis, while there has been almost no change in advisors’ usage of insurance products, the data points to a small decrease in exposure to mutual funds that’s essentially matched by an increased allocation to ETFs.
Notably, with the new firms excluded, the average advisor’s allocation to mutual funds is down to 70.6% in this year’s research from 71.3% last year, whereas their allocation to ETFs is 6.6%, up from 6%. At the same time, advisors’ allocations to banking products were down to 1.2% from 2.6% — while allocations to bonds were up to 2.2% from 1.4%, and the use of alternatives rose to 2.1% from 1.2% of the average book.
These trends also differ between the industry’s top performers and the rest of the advisor population. For instance, the increased use of ETFs is most evident among the top 20% of dealer advisors, who report that allocations to the product category jumped to 10.2% from 6.8% in last year’s DRC (This comparison again excludes the two new firms).
Meanwhile, the other 80% of advisors are primarily responsible for the reported decline in the usage of banking products (1.2% in this year’s report, down from 2.7%), and the corresponding jump in allocations to bonds and alternatives.
Compensation trends
Finally, when it comes to compensation, the addition of the two new firms also has a modest effect on our data — skewing the distribution slightly toward the lower end of the compensation scale. The inflection point for that difference is right around the $500,000 mark. Including the two new firms in our sample reduces allocations to compensation categories above that threshold and increases allocations below that level.
Across all firms in this year’s research, 24.2% of advisors reported annual compensation of more than $500,000. That share comes in at 26.2% if the two new firms are excluded, representing a meaningful increase from the 23.8% that reported earnings at that level in last year’s research.
Moreover, the increase all came at the upper end of the pay scale. The share of advisors who reported earning more than $1 million per year was 7.1% in this year’s report, up from 5.6% last year. If you exclude the new firms, it would be 8.1% for that metric.
This upward shift in compensation reflects the growth recorded by fund dealer advisors in 2025 — particularly the top-performing dealer advisors, who added clients and boosted their productivity. For the rest of the industry, productivity improved, too, but this largely came from culling client numbers, rather than growing assets.
Indeed, our research shows that, while the fund dealer business overall generated growth over the past year, the industry’s top performers achieved their growth much differently than most of the advisor population.
For both segments of the business though, the story was one of rising productivity — which is another way of saying a growing emphasis on higher-value clients.