There are two current trends that stand out in the Canadian business sector: weakening profitability and lower asset turnover, indications that companies aren’t doing very well in using their assets to generate income. In recent fiscal quarters, cash flow also has become an issue.
Corporate Canada’s profitability problem has been an issue for at least a decade, a problem that is most evident in declining return on equity at many firms. In particular, non-financial industries are losing ground in generating sales from their assets.
Based on Statistics Canada’s latest quarterly reports on results for the non-financial sector, cash flow has been eroding, mostly due to weak sales and rising costs. The downward direction of these corporate results emphasizes the challenges for investors in a six-year-old bull market that is striving to renew itself.
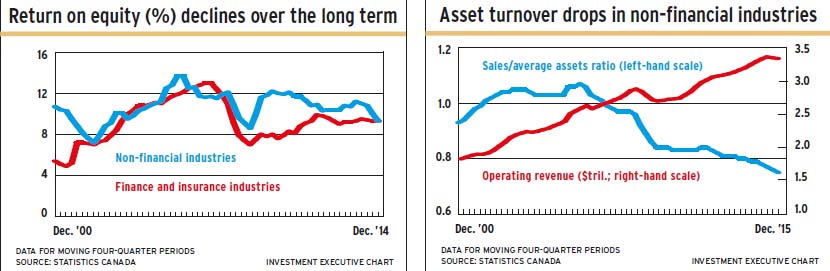
A return on equity (ROE) of around 13% is widely accepted to be the lowest acceptable ROE. By that measure, Canadian businesses are struggling. ROE for non-financial businesses dropped to 9.3% in the year ended June 30, 2015, the latest period reported. Compare that to a high of 13.7% in the year ended June 30, 2006, and to 10.3% in calendar 2012. (See chart on the left, above.)
For the Canadian financial services sector (including insurance), ROE has dropped in the same four-quarter periods: down from 11.9% in June 2006 to 9.8% in June 2012 and to 9.3% in June 2015.
This sector produced net income of $18.1 billion in the quarter ended June 30, 2015, and $70.7 billion in the year ended June 30, 2015.
For the non-financial industries sectors, operating revenue in the quarter ended June 30, 2015, was $832 billion: for the year ended June 30, 2015, this metric was $4,429 billion. Net income in the quarter ended June 30, 2015, was $42.8 billion, for a four-quarter total of $171.1 billion.
Non-financial businesses are struggling with a decade-long decline in turnover (the ratio of annual sales to total assets).
In the year ended June 30, 2006, non-financial businesses generated $1.07 in annual sales for each $1 in assets. That ratio since has dropped year by year to 75¢ in sales per $1 of assets in the year ended June 30, 2015. (See chart on the right, above).
However, while profit-making ability has weakened, corporate Canada’s balance sheet has become a bit stronger.
This is indicated by the ratio of equity to assets. Among non-financial businesses, equity rose to equal 42% of assets in calendar 2012. The ratio stayed at that level in the year ended June 30, 2015. This ratio was 39% in the year ended June 30, 2006.
There was similar improvement in the financial services sector. Among those firms, equity rose to 14.2% of assets in the year ended June 30, 2015, up from 13.5% in calendar 2012 and 13.2% in the year ended June 30, 2012.
On the other hand, cash flow has become a recent problem. For non-financial businesses, cash flow peaked at $241 billion in calendar 2012. In the year ended June 30, 2015, cash flow totalled $193 billion. That is a slight improvement from a low of $185 billion in the year ended March 31, 2014.
The cash-flow problem also occurs in the financial services sector, in which the stock-in-trade is cash. Mind you, this sector’s cash flows are more volatile. In the year ended June 30, 2015, this sector’s cash flow dropped to $22 billion, vs a high of $90 billion in the year ended June 30, 2014.
However, despite dropping cash flow, cash dividends in both the financial services and non-financial sectors have been growing handsomely. Since mid-2012, non-financial four-quarter dividend payments have climbed by 38% to June 30, 2015, while cash flow dropped by 20%. In the financial services sector, dividends increased by 17% in the same period, vs a 47% drop in cash flow.
Lower cash flow continues a weakening trend in the debt service coverage ratio. In the year ended June 30, 2006, cash flow available to service debt equalled 33% of non-financial industries’ total debt.
That level was the high point for non-financial industries since 2000. In the year ended June 30, 2015, this group’s debt service coverage ratio dropped to a new low of 18%.
There is a similar dropping trend in the financial services sector. In 2003, cash flow equalled 69% of debt. Through 2013 and 2014 and continuing into 2015, four-quarter cash flow to June 30, 2015, has been almost equal to the sector’s total debt.
Manufacturing, the largest of the non-financial sectors, also shows these trends. The sector shows a particularly marked drop in capital spending – a 61% plunge since the year ended June 30, 2013.
However, in oil and gas, capital spending continued to rise to a record high of $63.8 billion in the year ended March 31, 2015. In the subsequent quarter, that metric dropped by 16%.
Cash flow in these two sectors has held up so far, remaining above the recent low reached in the year ended Dec. 31, 2013. But negative return on equity and negative profit margins in the year ended March 31, 2015, reveal those sectors’ plight.
In retailing, asset turnover continues to drop. The sales/asset ratio dropped below 2.0 times in the year ended June 30, 2015. Ten years ago, retail sales were more than 2.5 times average assets.
© 2015 Investment Executive. All rights reserved.