
The markedly lower ratings that many financial advisors gave their firms in Investment Executive‘s (IE) 2018 Dealers’ Report Card signalled that there’s considerable dissatisfaction among advisors – many of whom saw significant changes at their dealer firms. But while the road ahead may be bumpy, many advisors also were hopeful it will smooth out soon.
Advisors’ pervasive dissatisfaction with their dealer firms was evident in the fact that 58 of the performance ratings given to firms on the Report Card’s main ratings table (see page 11) dropped by half a point or more compared with last year. (These totals exclude the “IE rating” and the “overall rating by advisors.”) In contrast, only 22 ratings increased by the same margin.
A big reason for this collective change was that advisors with Toronto-based HollisWealth Inc., Winnipeg-based Investors Group Inc. and Markham, Ont.-based Worldsource Wealth Management Inc. rated their firms lower in many categories because they felt unsettled as their firms go through significant transitions in ownership, management and technology, respectively.
HollisWealth advisors rated their firm’s performance lower by half a point or more this year in 12 of the 28 categories for which the firm received a score – as well as for the overall rating by advisors. This dissatisfaction stems largely from what advisors described as the rough transition taking place following Quebec City-based Industrial Alliance Insurance and Financial Services Inc.’s (IA) acquisition of HollisWealth from Bank of Nova Scotia, which was completed in August 2017. However, many HollisWealth advisors were hopeful that this is only a temporary rough patch and that IA will prove to be a good home for their businesses.
“It’s been a rough eight months,” says a HollisWealth advisor in Ontario. “But I’m still here because I’m very satisfied with what [IA] is doing to solve all the issues. [IA] seems like it’s going to be a pretty good company to work for.”
HollisWealth advisors were not alone in feeling uncertain about the state of affairs at their dealers. In fact, five firms in the Report Card were rated lower by half a point or more in the “firm’s stability” category. (See story on page 16.) In the case of Lévis, Que.-based Desjardins Financial Security Independent Network (DFSIN), for example, that company’s advisors were concerned about consolidation within the firm’s branch network.
“There’s a lot going on,” says a DFSIN advisor in British Columbia. “[The firm] is shutting down a whole bunch of branches.”
Technology woes are another reason why some firms’ ratings declined year-over-year. Worldsource advisors, for example, took their dealer to task this year, largely because of what they considered to be a bungled rollout of a new technology platform.
“[My firm] has converted to a new system, which has been a disastrous [transition],” says a Worldsource advisor in Ontario. “But I believe the [new] system is a good system. The commitment to the technology has been quite high.” (See story on page 17.)
Aside from changes taking place within firms, advisors also face potential changes in the wider investment industry – especially regarding embedded commissions. In light of a consultation paper released in January 2017 by the Canadian Securities Administrators (CSA), IE added a supplementary question to this year’s survey asking advisors if they’re in favour of regulatory action on embedded commissions.
A majority of advisors surveyed (52.5%) said they were not in favour of such action by the CSA. Most of those advisors were concerned such action would make finding advice more difficult for clients who have fewer assets and could create difficulties for rookie advisors entering the industry.
“We need to have embedded commissions as an option; they’re absolutely required in this industry,” says an advisor in Quebec with Richmond Hill, Ont.-based Global Maxfin Investments Inc. “Otherwise, how does a new advisor [enter this business]?”
One way for advisors to feel more in control of the ongoing changes taking place is for their managers to keep advisors well informed about what’s happening. However, many firms fell short of their advisors’ expectations in this matter.
Many of the dealers that garnered significant declines in their year-over-year ratings for the “firm’s effectiveness in keeping advisors informed” category often were the firms that went through significant changes during the past year. In large part, advisors at these firms believe they haven’t been kept in the loop properly about the status of the changes or what changes to expect.
“[Management] sends out electronic newsletters, but could use some different ways to keep us informed,” says a HollisWealth advisor in B.C. “And there’s no priority of information; it’s all thrown at you to sift through and decide what’s important.”
Despite the changes advisors face, they still run strong businesses. In fact, the average book of business increased to $38.4 million in assets under management this year from $36.6 million in 2017. Furthermore, advisors reported higher average productivity in this year’s Report Card: the average number of client households advisors serve declined slightly year-over-year to 197.7 from 199.3. (See story on page 12.)
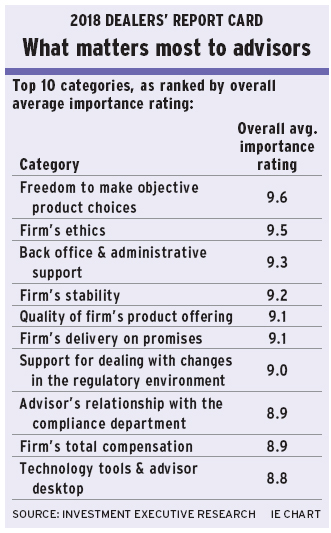
One reason why advisors were so successful is the calibre of products firms make available for advisors to offer their clients. In fact, advisors gave the highest and third-highest overall average performance ratings in the Report Card for “freedom to make objective product choices” (9.3) and “quality of the firm’s product offering” (8.8), respectively. In large part, advisors were full of praise for their dealers in these categories because of their ability to pick freely from their firms’ well-stocked product shelves.
“[My firm’s] product offering is the best out there,” says an advisor in Ontario with Toronto-based Assante Wealth Management (Canada) Ltd., “but I have freedom [to choose what’s best for my clients].”
HOW WE DID IT
PRODUCING INVESTMENT EXECUTIVE’S (IE) annual Dealers’ Report Card is a substantial task that requires a team of research journalists to speak with hundreds of advisors during a six-week period in February and March to gather the ratings and comments that form the foundation for this annual report.
This year, Sophie Allen-Barron, Anthony Burton, Ramona Leitao and Curtis Panke surveyed 505 financial advisors at 11 mutual fund dealer firms. These advisors were asked to provide two scores for each category included in the main table (see page 11): one for the firm’s performance; another for the importance of that category is to the advisor’s business. The ratings were given on a scale of zero to 10, with zero meaning “poor” or “unimportant” and 10 meaning “excellent” or “very important.”
Ratings listed in the main table that are in green type indicate that a score in that category increased by half a point or more year-over-year, while ratings in red type indicate that a category’s rating declined by that same margin year-over-year.
In an effort to increase the transparency of the Report Card process, this year’s main table includes a breakdown of the total number of advisors surveyed for each firm. As in years past, IE targeted 50 advisors per firm for the larger, national mutual fund and full-service dealers; 40 advisors for Calgary-based Portfolio Strategies Corp. and Windsor, Ont.-based Sterling Mutuals Inc.; and 30 advisors for Richmond Hill, Ont.-based Global Maxfin Investments Inc.
In addition to the ratings on the main table, survey participants were asked to share their thoughts on wider industry trends via two supplementary questions to this year’s survey:
1. Advisors were asked if they believe regulatory action is required to address concerns that regulators have raised regarding the industry’s use of embedded commissions.
2. Advisors also were asked if they believe their firm’s cybersecurity efforts were adequate to ensure the protection of their data and those of their clients.
As well, IE produced web content for this Report Card in the form of a video and two slideshows. The video breaks down the results of this year’s Report Card, while the slideshows, which will be published throughout June, will provide greater insight into the data collected in this year’s survey.
SOURCE: INVESTMENT EXECUTIVE RESEARCH IE CHART