Infographics offer an opportunity to present information in creative, appealing ways. You can use them to transform financial concepts and data into accessible images — such as charts, graphs and illustrations — that clients can understand.
“They’re a great way to visualize what you do,” says Larry Distillio, assistant vice president, practice management, at Mackenzie Investments in Toronto. “They give a snapshot that people can digest easily.”
Infographics allow you to condense large amounts of information onto a single image or a single page. An elegantly designed infographic uses text sparingly, pairing words with strong visuals to express an idea. In many cases, Distillio says, you can use infographics as a visual aid in your conversations with clients about their financial goals.
Here are some practical ways you can use infographics to communicate more effectively with your clients:
> Facilitate decision-making
Infographics can be used as a resource for clients confronted with a financial decision. Use them to illustrate how the client might navigate the process of putting together a philanthropic plan or an estate plan, Distillio says.
An infographic can help clarify the steps — and the players — involved in putting a plan together.
> Make sense of statistics
You can put statistical information that’s in the public domain into perspective for your clients, says Jim Wortley, assistant vice president and creative director at Mackenzie Investments in Toronto.
For example, you might compile historical stock-market performance data or interest rates into a chart. Or, you might create an infographic that demonstrates increasing life expectancies.
Using statistics that were complied independently can enhance your infographic’s credibility. “It becomes more interesting,” Wortley says, “and anything else we say will bathe in the halo of a good fact.”
> Speak to a niche market
You can develop a series of infographics tailored to a specific segment of your clientele. For example, Distillio suggests structuring them around the life-changing events that a pre-retiree or business owner will encounter.
With an infographic, you can give your clients a big-picture look into the decisions that lie ahead.
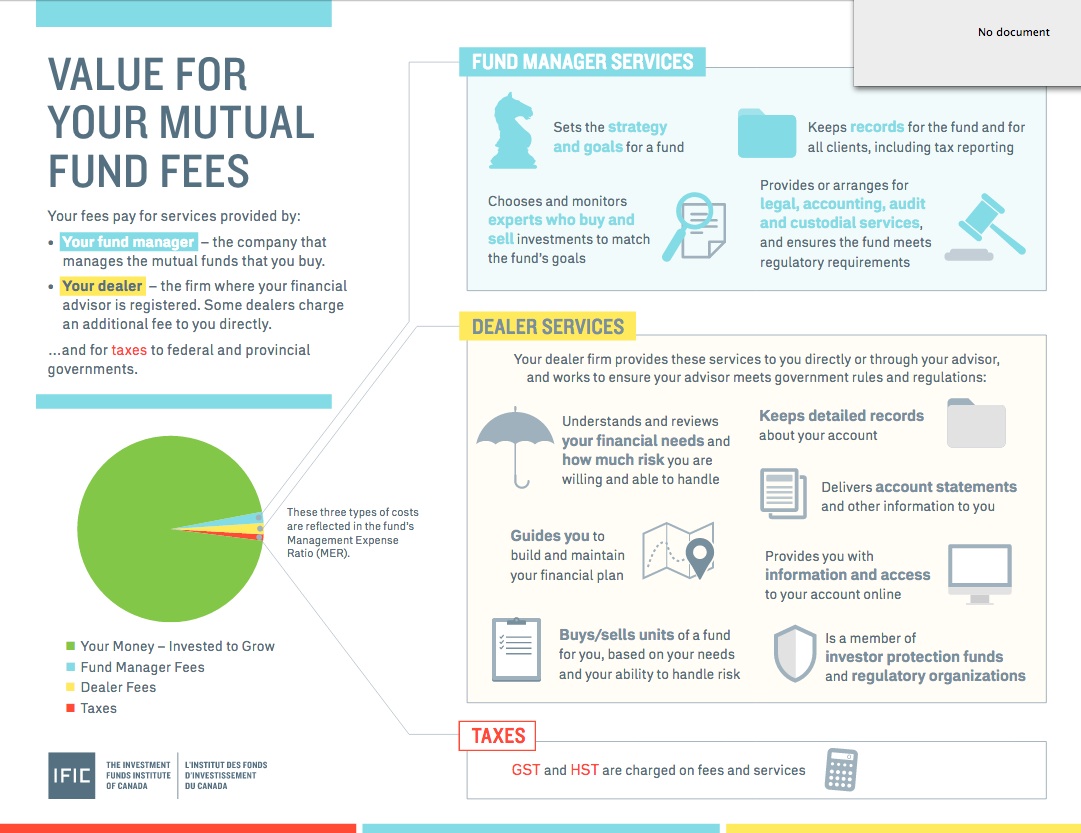
> Demystify fees
The new mandatory fee disclosure rules have placed pressure on advisors to demonstrate their value to clients. You can use an infographic to break down how the fees your clients pay are distributed, Distillio says, and map out the services that you offer in return.
Your goal is to show your clients how the industry operates, Distillio says, while making the case for clients to choose you over your competition.
> Make them shareable
Infographics perform well on social media, where visuals, such as images and videos, are prized over text-only posts, Distillio says.
When you create an infographic, provide clients with a hard copy and publish it online, so they can share it with others and drive traffic back to your website.
This is the second part of a two-part series on infographics.
Photo copyright: IFIC