Financial advisors in the dealer channel are enjoying stellar growth, but – with a rapidly aging sales force and evolving client expectations – the future is uncertain for these advisors.
At a time when the Canadian economy is limping along and domestic investment markets are lagging, advisors in the dealer business are turning in some impressive top-line results. According to Investment Executive’s (IE’s) 2013 Dealers’ Report Card, average assets under management (AUM) have risen to a new high of $27.8 million – a stunning 17% increase from $23.7 million a year ago.
Undoubtedly, this is an impressive result. Market returns haven’t been nearly strong enough to drive that sort of organic AUM growth over the past year. Instead, this increase in AUM is coming from the reps’ own book-building efforts, which are reflected in both higher AUM and productivity (as measured by AUM/client household).
Yet, advisors aren’t simply adding AUM by clutching at every possible client; nor are they bolstering productivity by culling their books and getting rid of smaller accounts. Rather, advisors are both adding clients and enhancing their AUM/client household, which suggests that advisors in the dealer channel are taking market share from other segments of the retail investment sector.
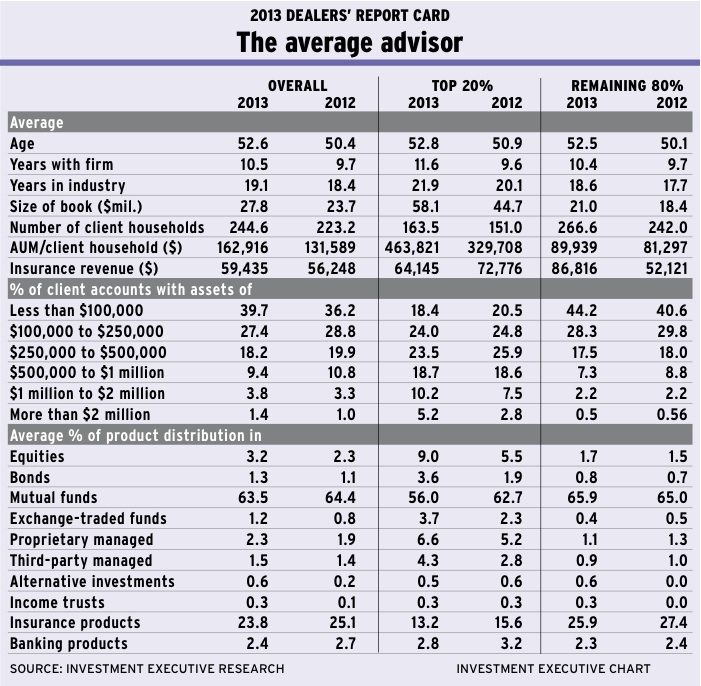
The data indicate that dealer reps’ growth is coming from the combination of larger client rosters and increased productivity. The average dealer rep saw his or her book increase to 245 client households in 2013 from 223 last year. Yet, these larger books aren’t coming at the expense of AUM/client household, which rose to $162,916 for the average rep this year from $131,589 last year.
These trends are reflected in both segments of the dealer sales force – among both the channel’s top producers and the rest of the channel. (IE divides the rep population into the top 20% of producers and the remaining 80%, based on AUM/client household.) Looking at these two segments, it’s clear that although both are enjoying success, it’s the top performers that really drove the growth over the past year.
The top 20% of dealer reps have seen their AUM outpace the channel overall, with average AUM jumping to $58.1 million from $44.7 million year-over-year. This top-producing group also grew their client rosters to 164 households from 151 households in 2012.
Given this modest increase in client numbers amid very strong AUM growth, it’s this top group’s productivity numbers that enjoyed the biggest gain, with average AUM/client household for these reps rising to $463,821 from $329,708.
For the rest of the rep population, the direction of these trends is the same, but the size of the moves is notably smaller. According to IE’s latest survey, the remaining 80% of reps also saw their AUM grow from the previous year, albeit at a much slower rate, to $21 million from $18.4 million. Their client rosters also got bigger, increasing to 267 client households from 242 client households over the past year. And these advisors’ productivity grew as well, with average AUM/client household reaching $89,939 compared with $81,297 a year ago.
The differences in the two sides of the dealer channel also are evident in the account AUM distribution data. For the top performers, their exposure to the largest client accounts increased notably over the past year, whereas growth for the rest of the channel appears to be coming from an increasing number of smaller accounts.
The top 20% of fund dealer reps report that their allocations to all account AUM categories below the $500,000 threshold declined compared with the previous year. The $500,000-$1 million account AUM range is barely changed, but allocations to accounts worth more than $1 million have jumped to 15.4% this year from 10.3% a year ago. As well, this advisor segment’s exposure to accounts worth more than $2 million almost doubled to 5.2% this year from 2.8% in 2012; and even though this category remains the smallest for these advisors, the year-over-year growth still is remarkable.
Conversely, among the remaining 80% of reps, their exposure to the largest accounts is essentially unchanged from a year ago. For these reps, only 2.7% of their books fall into accounts worth more than $1 million – and just 0.5% is attributable to accounts worth more than $2 million.
Instead, the growth for this segment of the dealer channel is coming from the smallest accounts (those worth less than $100,000). These small accounts represent the biggest proportion of their books, at 44.2% vs 40.6% last year. Indeed, for a population whose average AUM/client household is $89,939, it’s still possible to grow AUM and increase productivity with accounts in the sub-$100,000 range.
But regardless of whether advisors’ bigger books are built on high net-worth clients or just middle-class investors, the dealer channel certainly has managed to achieve some impressive top-line results over the past year. And this, in turn, is translating into healthier bottom lines for the reps.
The strong growth in AUM and increased productivity appears to be providing a slight boost to advisors’ own compensation. The proportion of dealer reps who report earning less than $100,000 a year is down a bit from last year, while those who say they are in the $100,000-$250,000 range is up to 42.7% from 40.9%.
At the same time, the number of reps at the very top end of the earnings scale – those who claim to be earning more than $1 million – is up a bit compared with last year’s survey. This would seem to echo the trends that are evident in account AUM distribution, with top producers successfully boosting the representation of the very high-value accounts within their books and the rest of the channel making gains with more mainstream clients.
Given the favourable AUM and productivity trends in this year’s survey, it would appear that the dealer business is in great shape. However, these currently positive indicators don’t necessarily mean that the business’s future is secure. In fact, the demographics of the rep population suggest that the dealer channel is less of a strong growth proposition and more a maturing trade.
Case in point: the average age of dealer reps this year is 52.6, up from 50.4 in 2012. This increase of more than two years implies that the sales force is aging rapidly – possibly because it’s not getting an adequate infusion of new blood, younger reps are leaving the channel for alternative careers, older reps are hanging around for longer or, most likely, some combination of all these factors.
Whatever the underlying reasons, the channel’s aging population can pose several problems – from difficulty maintaining client service to trouble retaining AUM – as the rep population matures alongside their clients, and both the channel and its clients face retirement and transition issues in the years ahead. So, although the past year’s growth has certainly been impressive, its long-term sustainability may be an emerging concern.
At the same time, in this volatile, low-return environment with its heightened regulatory concerns about the costs of investing and standards of care, dealers may find themselves coming under increasing pressure to diversify their offerings. Although there’s little sign of this in the overall dealer business, there are hints emerging among the channel’s top producers.
The latest data indicate that the average rep’s approach to asset allocation hasn’t changed much over the past year. Mutual funds remain the dominant product within reps’ books, accounting for almost two-thirds of AUM, although this asset class’s share of book is down slightly from the previous year – as are allocations to banking and insurance products.
Various investment alternatives – such as equities, exchange-traded funds (ETFs) and managed products (both proprietary and third-party) – are gaining percentage share in the average rep’s book. The share for each of these other products remains small overall, but some of the relative gains in their allocations are rather large.
For example, although the allocation to equities is still just 3.2%, that’s up by almost 40% from a year ago, when the average book had 2.3% in equities. Similarly, exposure to ETFs remains minimal at just 1.2%, but this is up notably from 0.8% a year ago.
Not surprising, it’s the top 20% of reps who are leading the way in some of these evolving asset-allocation trends. Given these advisors’ much larger books overall and higher proportion of high net-worth clients within these books, it’s to be expected that this group of advisors will have a greater need and ability to serve clients with products beyond the plain-vanilla mutual fund.
Indeed, top producers report that their allocation to mutual funds is down to 56% of their book from almost 63% a year ago. At the same time, this advisor segment is leading the push into other investments, with equities up to 9% of their books, almost double the 5.5% allocation a year ago. Similarly, exposure to ETFs has jumped to 3.7% this year from 2.3% last year, and the allocation to bonds is up to 3.6% from 1.9%.
The channel’s top producers also ramped up their use of managed products, with proprietary managed products now accounting for 6.6% of the average book, up from 5.2% in 2012, and allocations to third-party managed products is growing even faster, accounting for 4.3% of the average top producer’s book, up from 2.8% last year.
In contrast, there have been hardly any changes in the allocations to these sorts of products for the remaining 80% of advisors. In fact, their use of mutual funds has actually ticked upward over the past year, to 65.9% from 65%, and their allocations to other investment products (except for insurance products) have remained minimal.
Yet, with the top producers leading the way, the dealer channel is likely to face growing pressure to expand and diversify beyond the constraints of the mutual fund business. Given the aging advisory sales force, it remains to be seen if the dealer channel can respond adequately in the years ahead.
© 2013 Investment Executive. All rights reserved.