Infographics can be an effective tool to help your clients understand financial concepts and projections. Visual representations of data and information can simplify and explain concepts in ways that numbers and words can’t. Through charts and graphs, you can communicate trends and put percentages into context.
Infographics can provide a “bird’s-eye perspective [and] link information to a big picture,” says Tanya Gadsby, graphic recorder and owner of Drawing Out Ideas in Victoria.
But charts and tables can be boring and confusing if you don’t approach them with the right degree of creative flair. To keep things interesting — and relevant — use a professional designer and make sure he or she understands your objectives.
The following tips can help ensure you develop visuals that are compelling and effective:
> Know your audience
Determine the scope of your subject and the demographic of your audience, Gadsby says. Understanding your audience’s level of knowledge about the topic at hand will enable you and the designer to come up with a way to illustrate the points most effectively. You can guide the designer in the level of complexity to incorporate in the designs.
> Strive for the “wow” factor
Aim for a blend of “genuinely arresting information” and striking illustrations, says Jim Wortley, assistant vice president and creative director with Mackenzie Investments in Toronto.He cautions against merely adopting the style of a standard infographic — stock images or clip art used in a cut-and-paste fashion, for example — which often is neither informative nor graphic.
Instead, your design should provide new insights into the topic.
> Don’t oversimplify
Strike a balance between using graphics to illustrate your point, and using text to expand on it. There’s always a risk that too much emphasis on imagery will come across as overly simplistic, Gadsby says.
Treat the development of your infographics as a collaborative process between you and the designer, she adds.
For example, although Wortley and his team design and develop infographics themselves, they sometimes ask advisors for a second opinion on whether it’s too simple — or too complex.
> Refine the ideas
Don’t feel that you have to settle for the first version of the infographic. You may need to work with the designer to assess whether its visual impact and presentation of data are appropriate.
For example, Gadsby often runs through several drafts and involves her clients in the storyboard process, so they can review and revise it together. “They walk me through a lot of the background in specific concepts,” she says. “And that helps them explain it as well.”
> Keep it short
Whittle the information down to bite-sized chunks, says Wortley. You want your clients to be able to parse information quickly, and revisit it easily.
The designer can offer that outside perspective, Gadsby says, to help you determine which visuals work, and help you better express financial concepts in layman’s terms.
Also, make sure pertinent facts are properly attributed, perhaps as a footnote within the infographic. As the designer’s client, you will be responsible for the accuracy of the data and ensuring the messages will not be misinterpreted.
This is the first part in a two-part series on developing infographics for your presentations. Next: Ideas on how to use infographics.
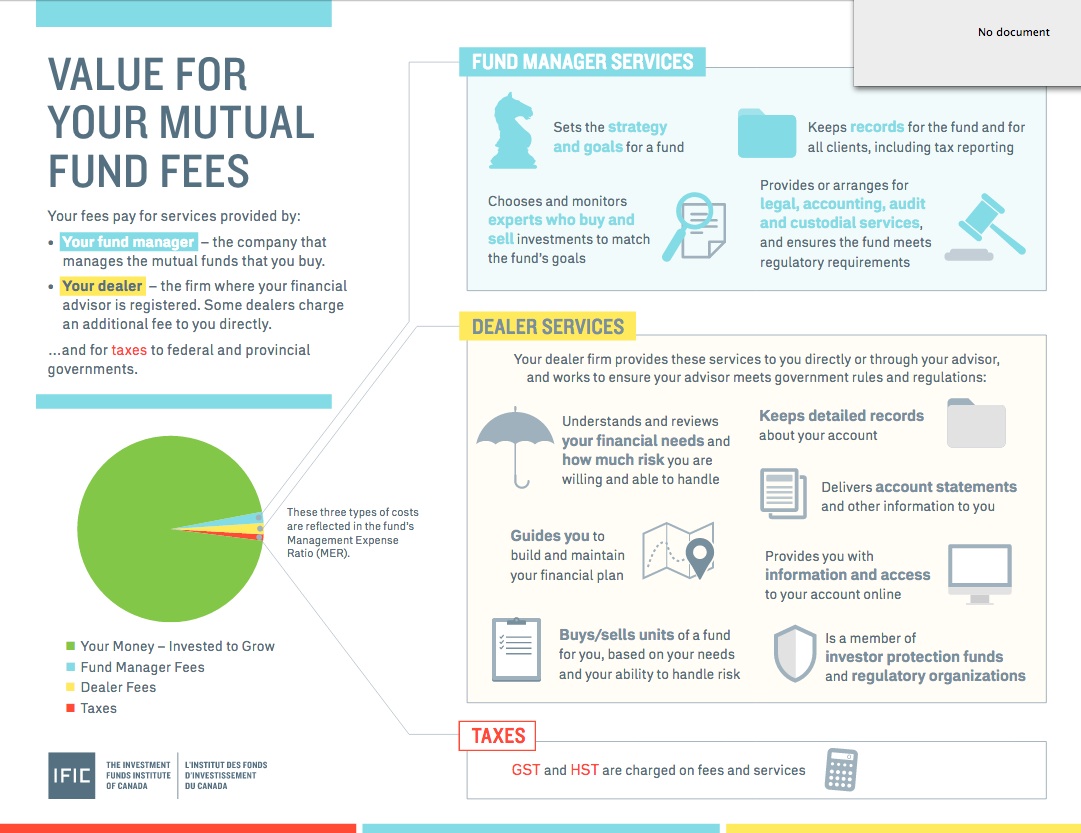
Photo copyright: IFIC